Using a graphic display calculator
© Oxford University Press 2012: this may be reproduced for class use solely for the purchaser’s institute
Casio fx-9860GII
2.5 Graphing a numerical derivative
Although the calculator can only evaluate a numerical derivative at a point,
it will graph the gradient function for all values of x.
Example 33
If
y
x
x
=
+3
,
draw the graph of
d
d
y
x
.
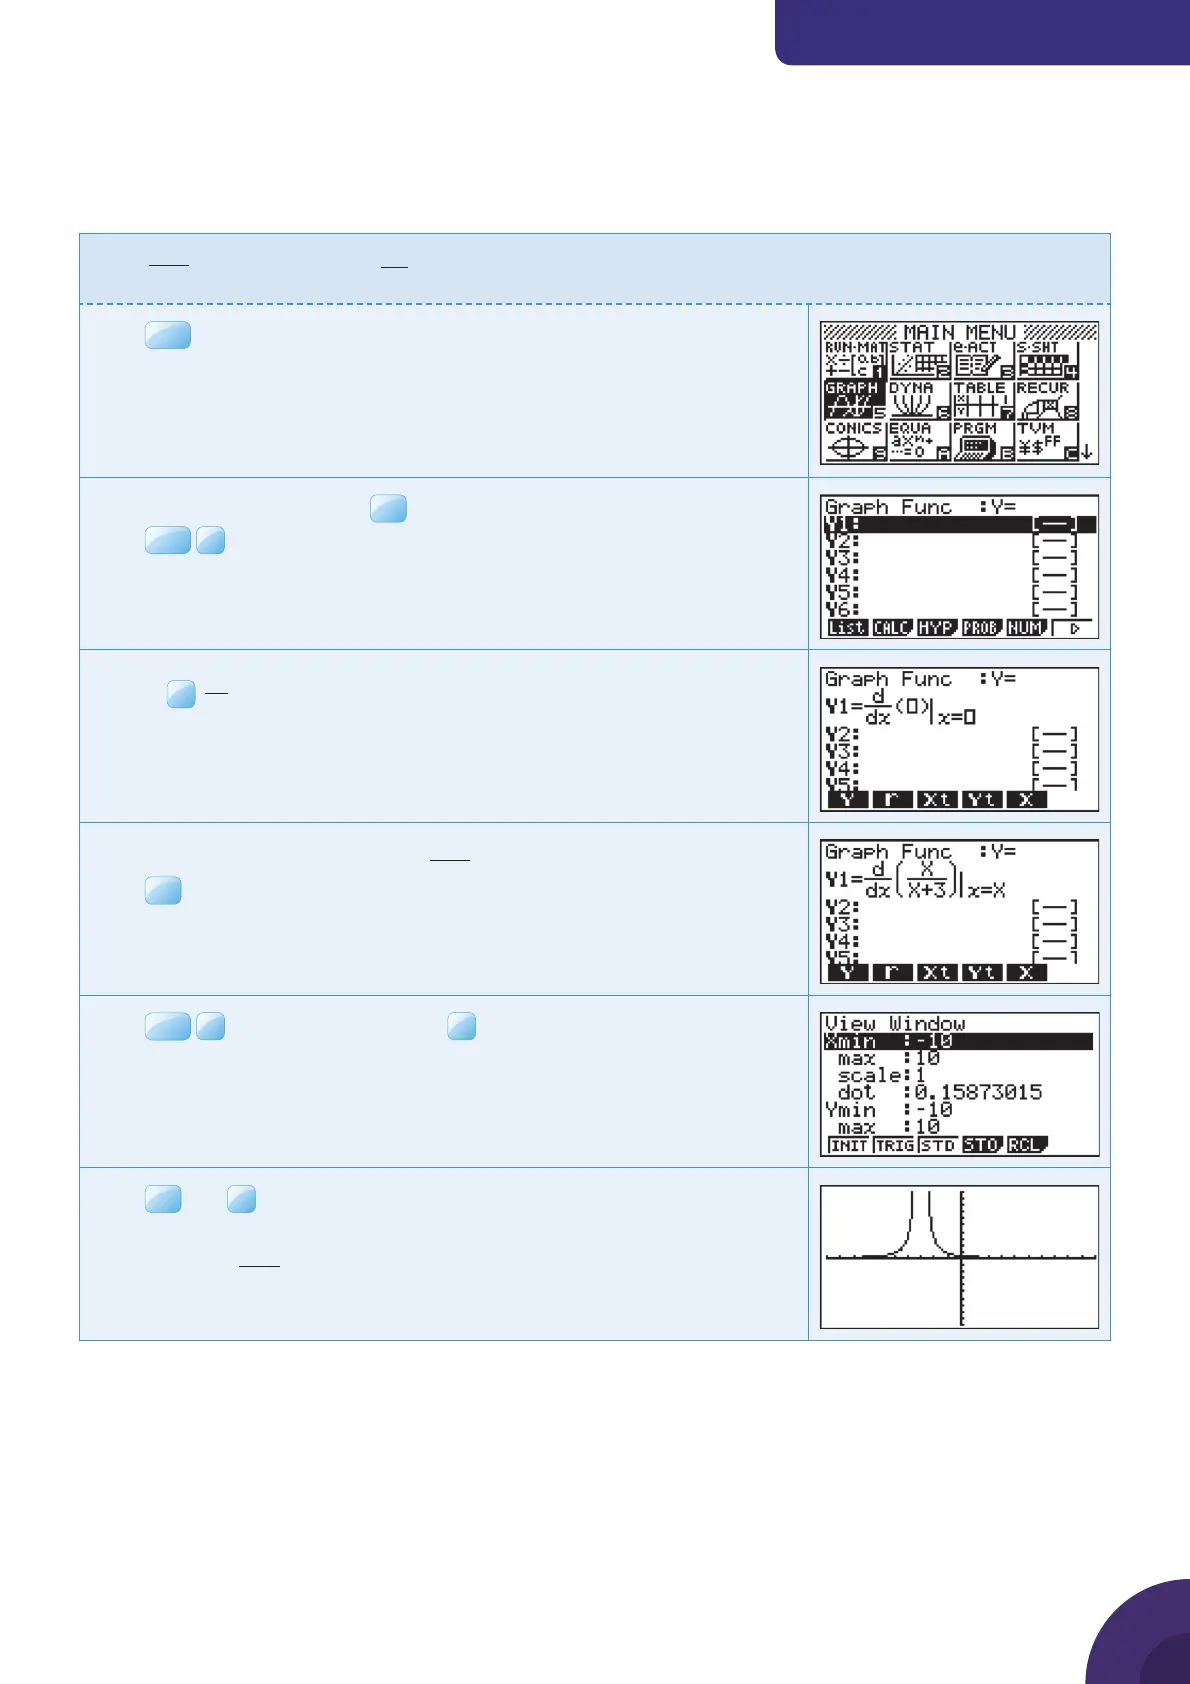
Press
MENU
. You will see the dialog box as shown on the right.
Choose 5: GRAPH and press
EXE
.
Press
OPTN
Choose
F1
d
dx
to choose the derivative template.
In the template enter x, the function
x
x +3
and the value x.
Press
Press
SHIF T
F3
V-Window and choose
F3
STD for the default axes
which are −10 ≤ x ≤ 10 and −10 ≤ y ≤ 10.
Press
EXE
and
F6
DRAW.
The GDC displays the graph of the numerical derivative
function of
y
x
x
=
+3
32

 Loading...


