Using a graphic display calculator
© Oxford University Press 2012: this may be reproduced for class use solely for the purchaser’s institute
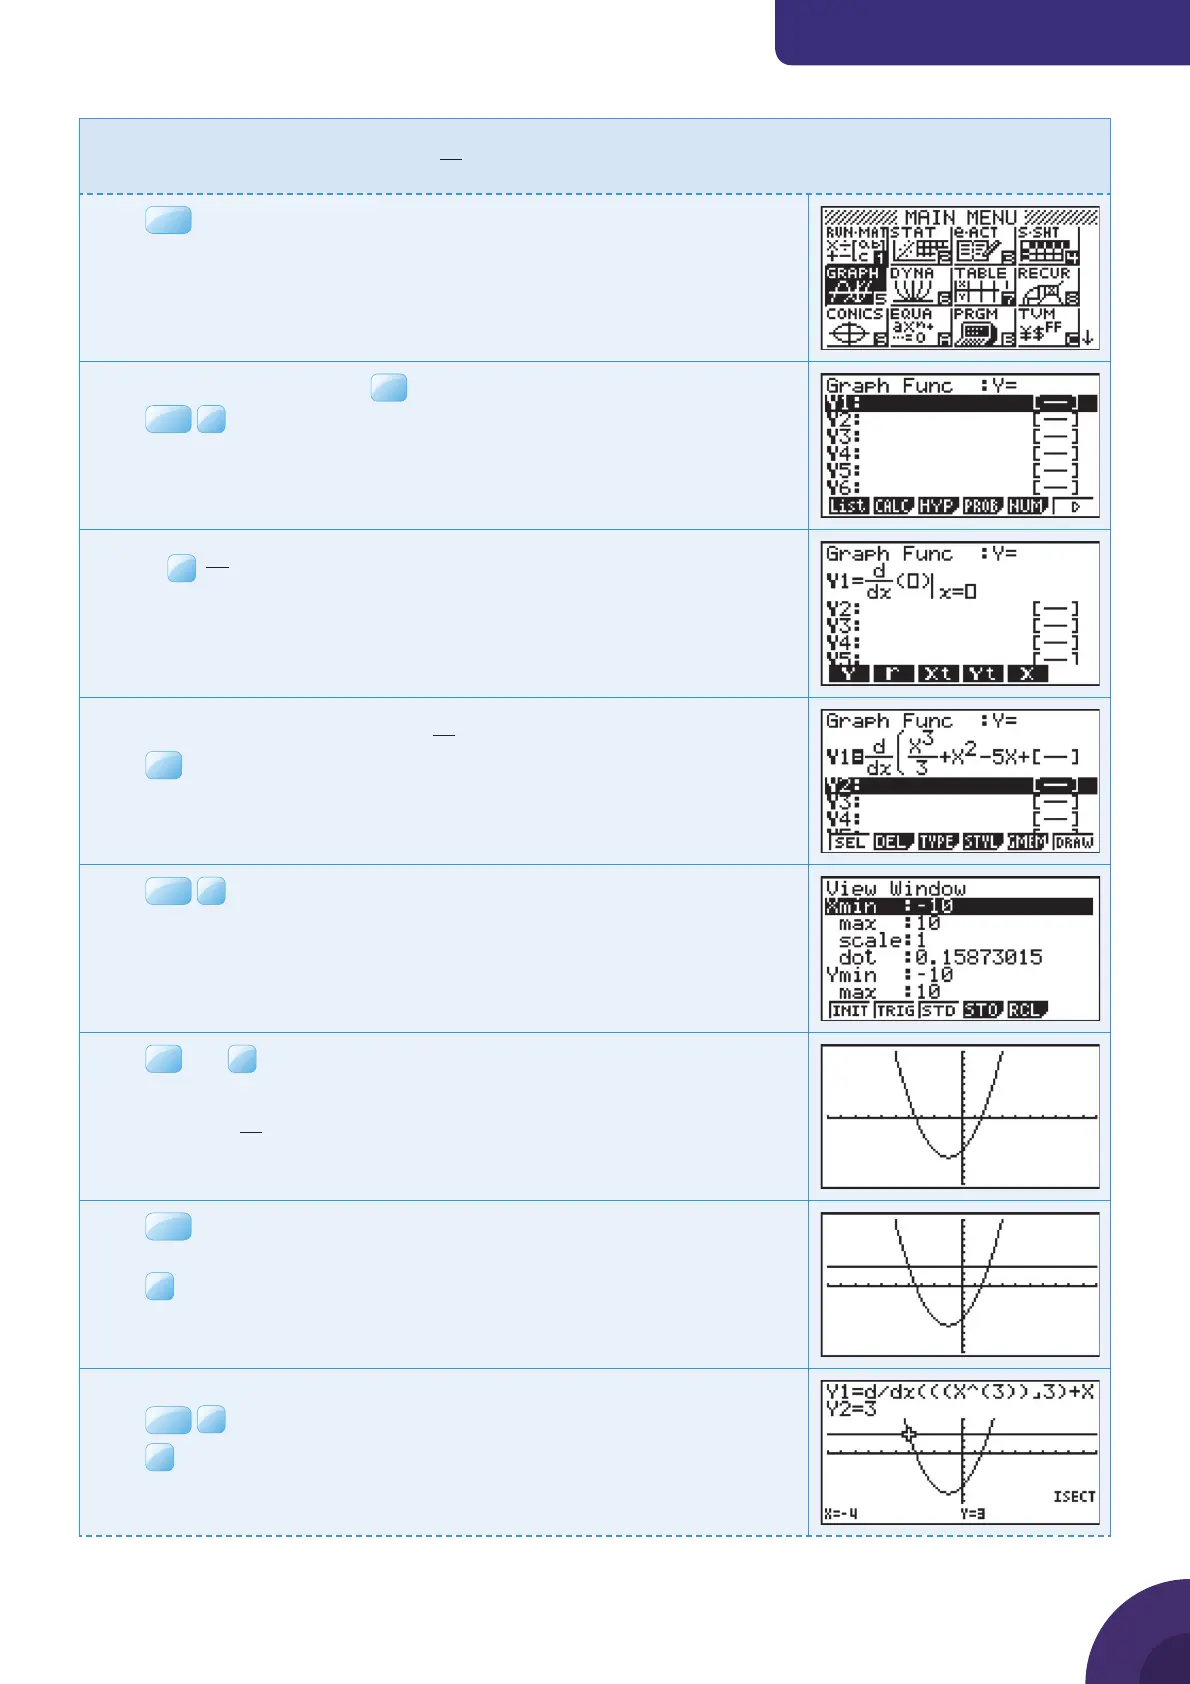
Casio fx-9860GII
Example 34
Find the values of x on the curve
yxx
x
=+−+
3
2
3
51
where the gradient is 3.
Press
MENU
. You will see the dialog box as shown on the right.
Choose 5: GRAPH and press
EXE
.
Press
OPTN
Choose
F1
d
dx
to choose the derivative template.
In the template enter x, the function
x
xx
3
2
3
51+−+
and the value x.
Press
Press
SHIF T
F3
V-Window and choose STD for the default axes
which are −10 ≤ x ≤ 10 and −10 ≤ y ≤ 10.
Press
EXE
and
F6
DRAW.
The calculator displays the graph of the numerical derivative
function of
yxx
x
=+−+
3
2
3
51
Press
EXIT
to display the Y= editor.
Enter the function Y
2
= 3.
Press
F6
DRAW.
The calculator now displays the curve and the line y = 3.
To fi nd the points of intersection between the curve and the line:
Press
SHIF T
F5
G-Solv.
Press
F5
ISCT.
The GDC shows a point of intersection at (4, 3).
{ Continued on next page
33

 Loading...


