Using a graphic display calculator
© Oxford University Press 2012: this may be reproduced for class use solely for the purchaser’s institute
Casio fx-9860GII
1.19 Drawing trigonometric graphs
Example 22
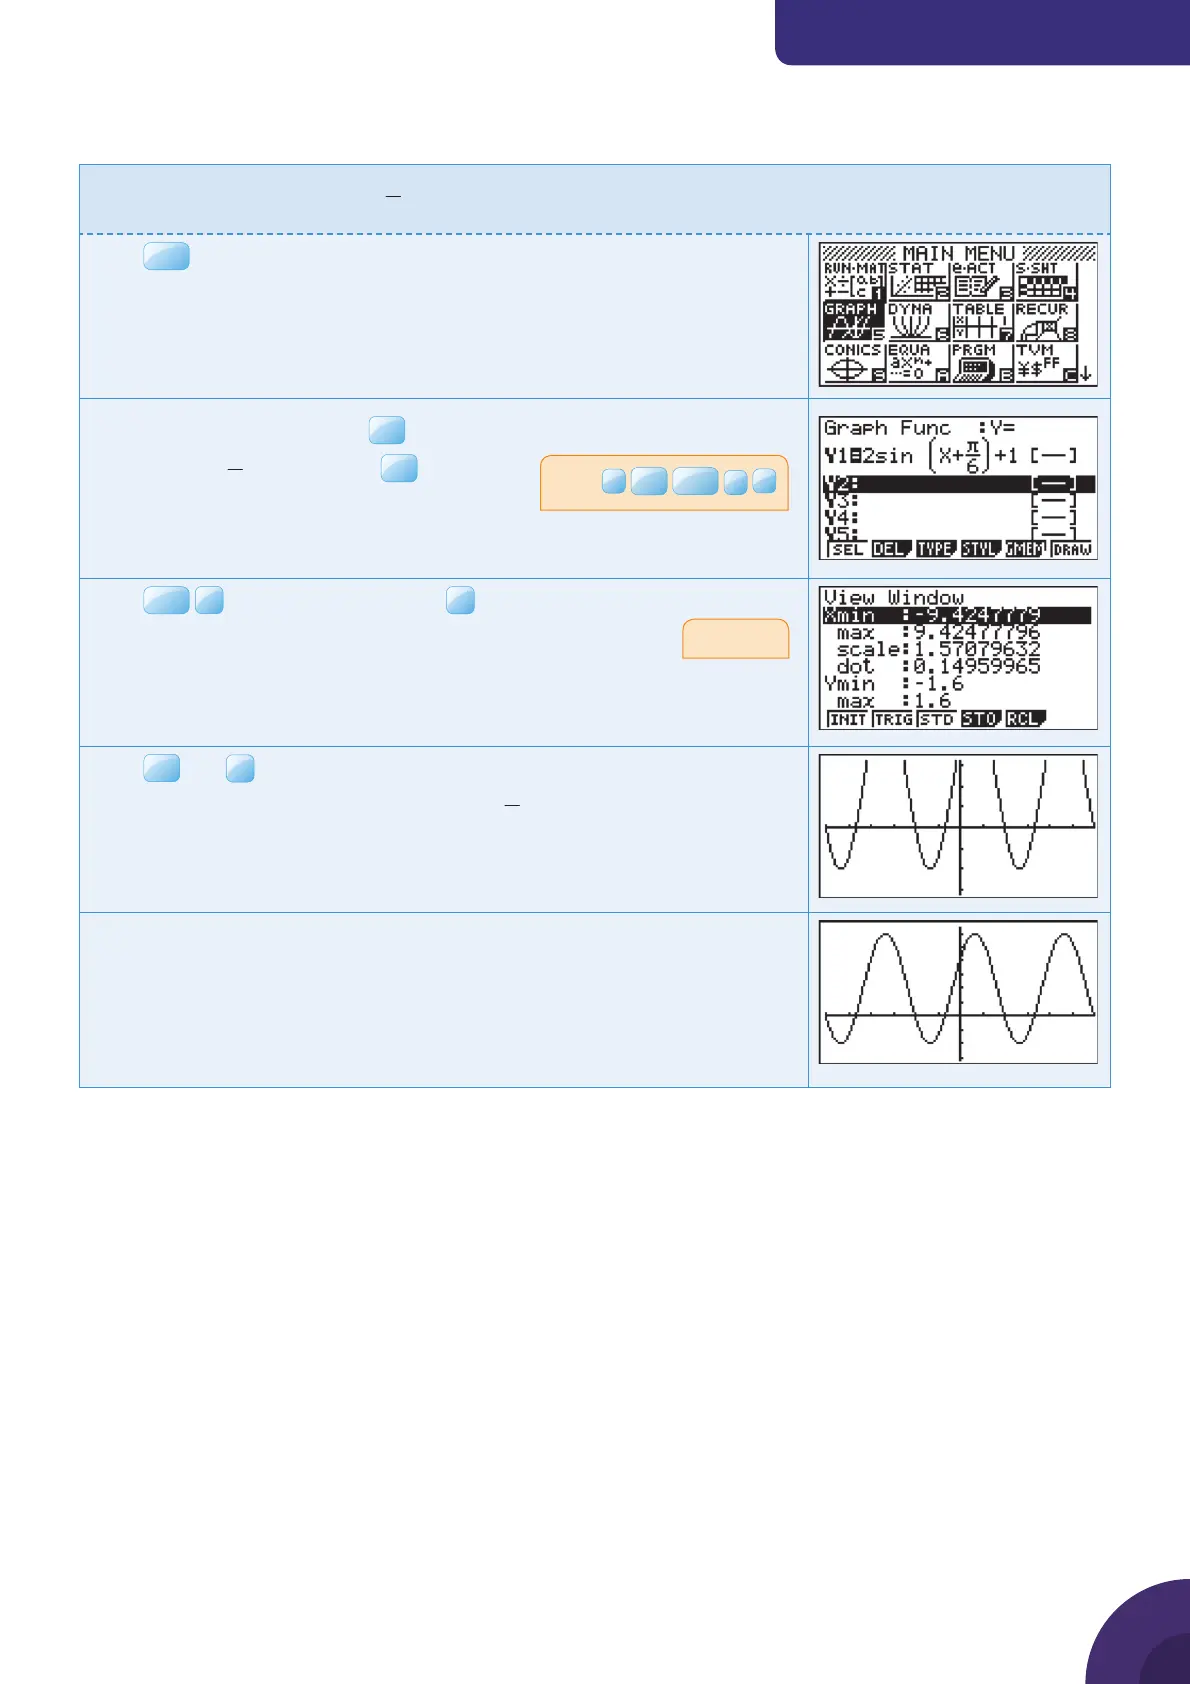
Draw the graph of
6
2sin 1yx
S
§·
¨¸
©¹
.
Press
MENU
. You will see the dialog box as shown on the right.
Choose 5: GRAPH and press
EXE
.
Type
6
2sin 1x
S
§·
¨¸
©¹
and press
Press
SHIF T
F3
V-Window and choose
F2
TRIG for the default axes
which are −9.42 ≤ x ≤ 9.42 and −1.6 ≤ y ≤ 1.6.
Press
EXE
and
F6
DRAW.
The GDC displays the graph of
6
2sin 1yx
S
§·
¨¸
©¹
.
Change the y-axis to make the trigonometric curve fi t the screen better.
Press
2
log
X,i,T
+
3
9.42 ≈ 3π
23

 Loading...


