Using a graphic display calculator
© Oxford University Press 2012: this may be reproduced for class use solely for the purchaser’s institute
Casio fx-9860GII
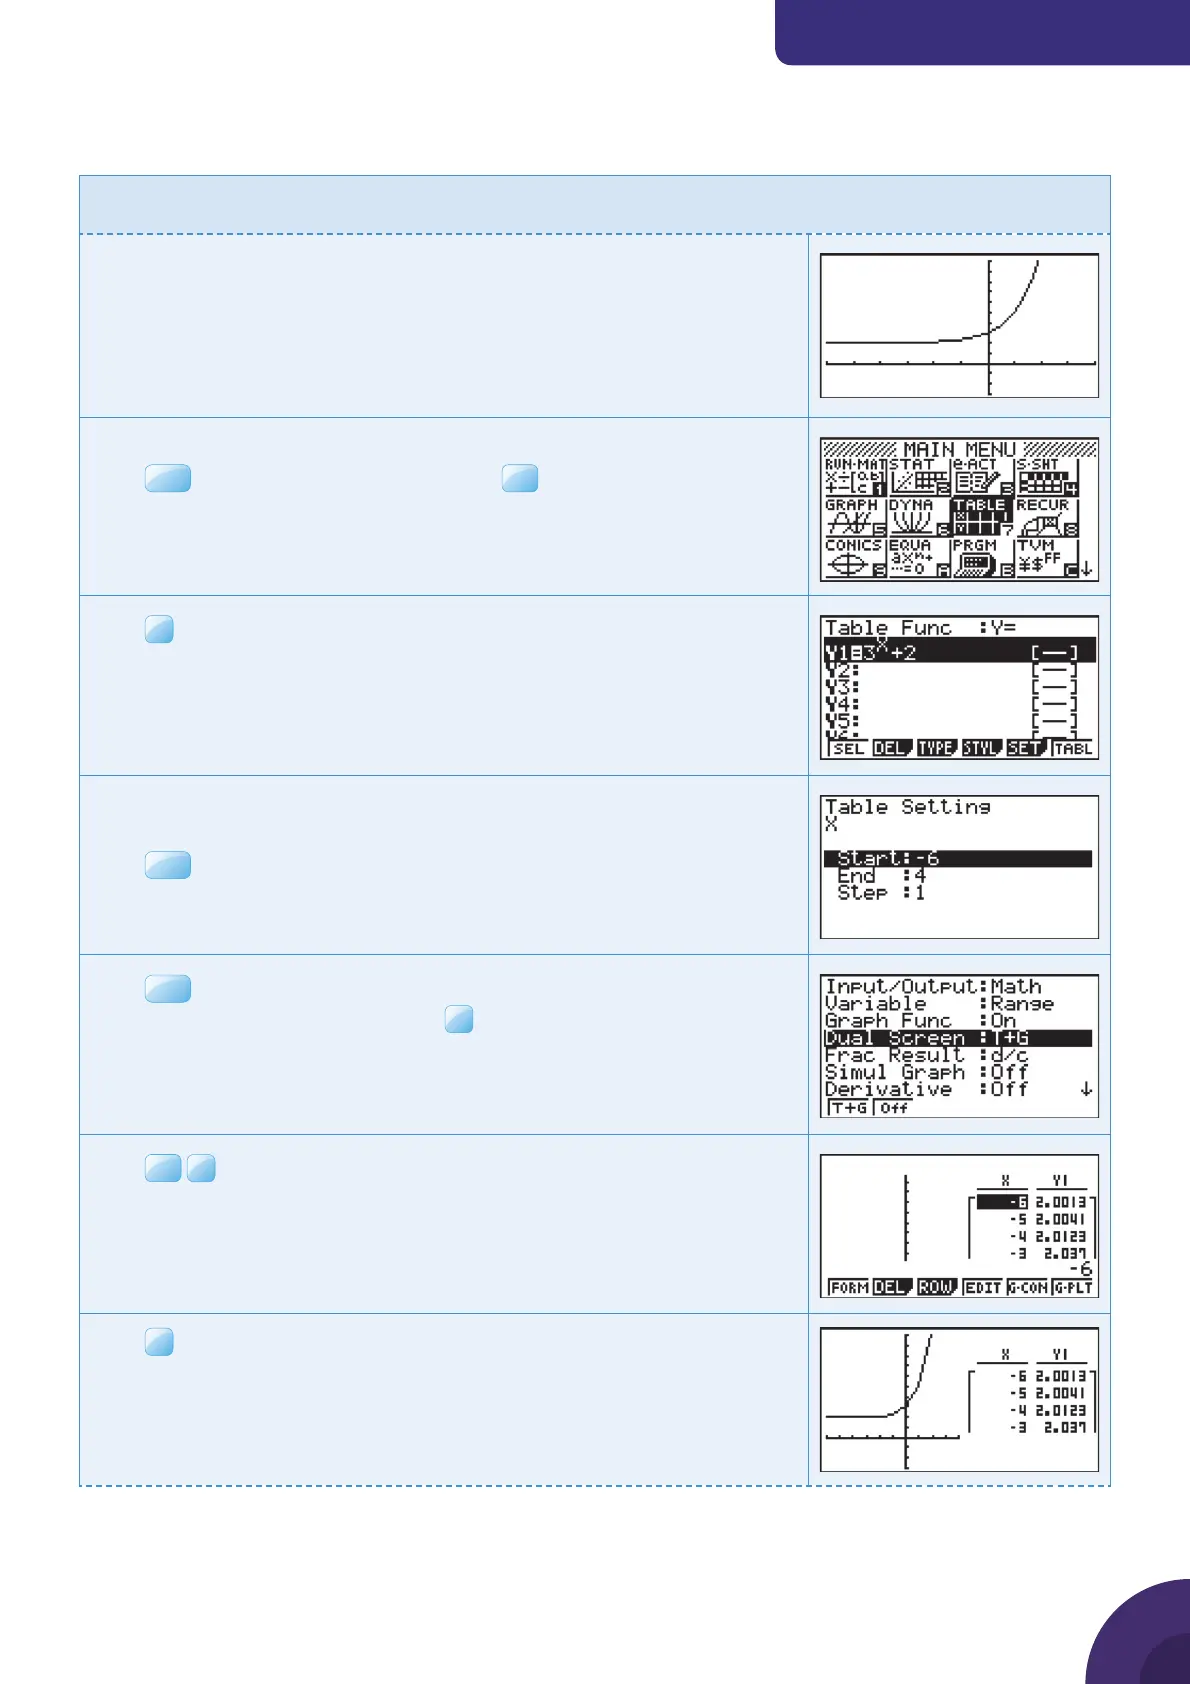
1.14 Finding a horizontal asymptote
Example 17
Find a horizontal asymptote to the graph of y = 3
x
+ 2.
Draw the graph of y = 3
x
+ 2 (See Example 16).
You can look at a table of the values of the function.
Press
MENU
and choose 7: TABLE and press
Press
Choose a start and end point for the table and a step of 1.
Use the x-values from the graph you drew.
Press
Press
SHIF T
SET UP.
Scroll down to Dual Screen and press
Press
EXE
Press
F5
G·CON to display the graph alongside the table.
{ Continued on next page
19

 Loading...


