Using a graphic display calculator
© Oxford University Press 2012: this may be reproduced for class use solely for the purchaser’s institute
Casio fx-9860GII
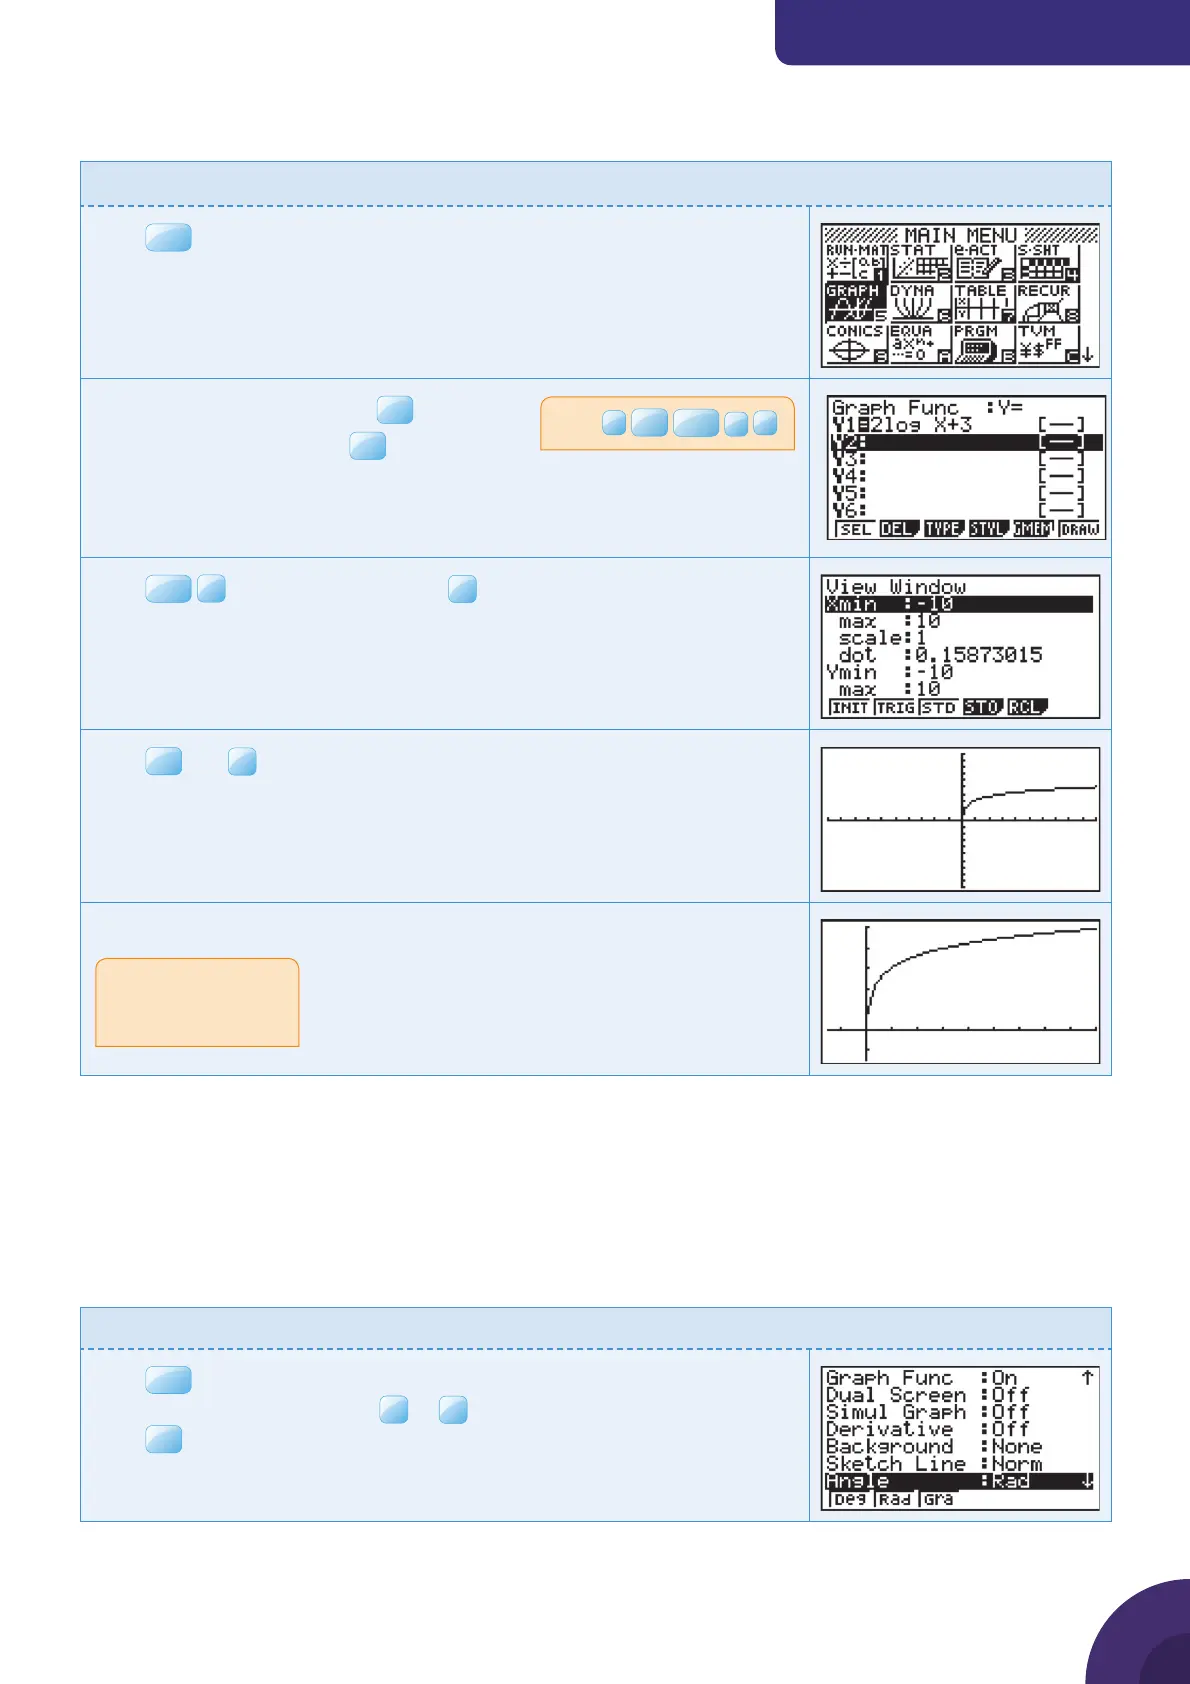
1.17 Drawing a logarithmic graph
Example 20
Draw the graph of y = 2log
10
x + 3.
Press
MENU
. You will see the dialog box as shown on the right.
Choose 5: GRAPH and press
EXE
.
Type 2log(x) + 3 and press
Press
SHIF T
F3
V-Window and choose
F3
STD for the default
axes which are −10 ≤ x ≤ 10 and −10 ≤ y ≤ 10.
Press
EXE
and
F6
DRAW.
The graphs of y = 10y = 2log
10
x + 3
x
is displayed with the default axes.
Change the axes to make the logarithmic curve fi t the screen better.
Trigonometric functions
1.18 Degrees and radians
Work in trigonometry will be carried out either in degrees or radians. It is important, therefore,
to be able to check which mode the calculator is in and to be able to switch back and forth.
Example 21
Change angle settings from radians to degrees and from degrees to radians.
Press
SHIF T
SET UP.
Select either Deg or Rad using
F1
or
F2
.
Press
Press
2
log
X,i,T
+
3
For help with changing
axes, see your GDC
manual.
22

 Loading...


