Using a graphic display calculator
© Oxford University Press 2012: this may be reproduced for class use solely for the purchaser’s institute
Casio fx-9860GII
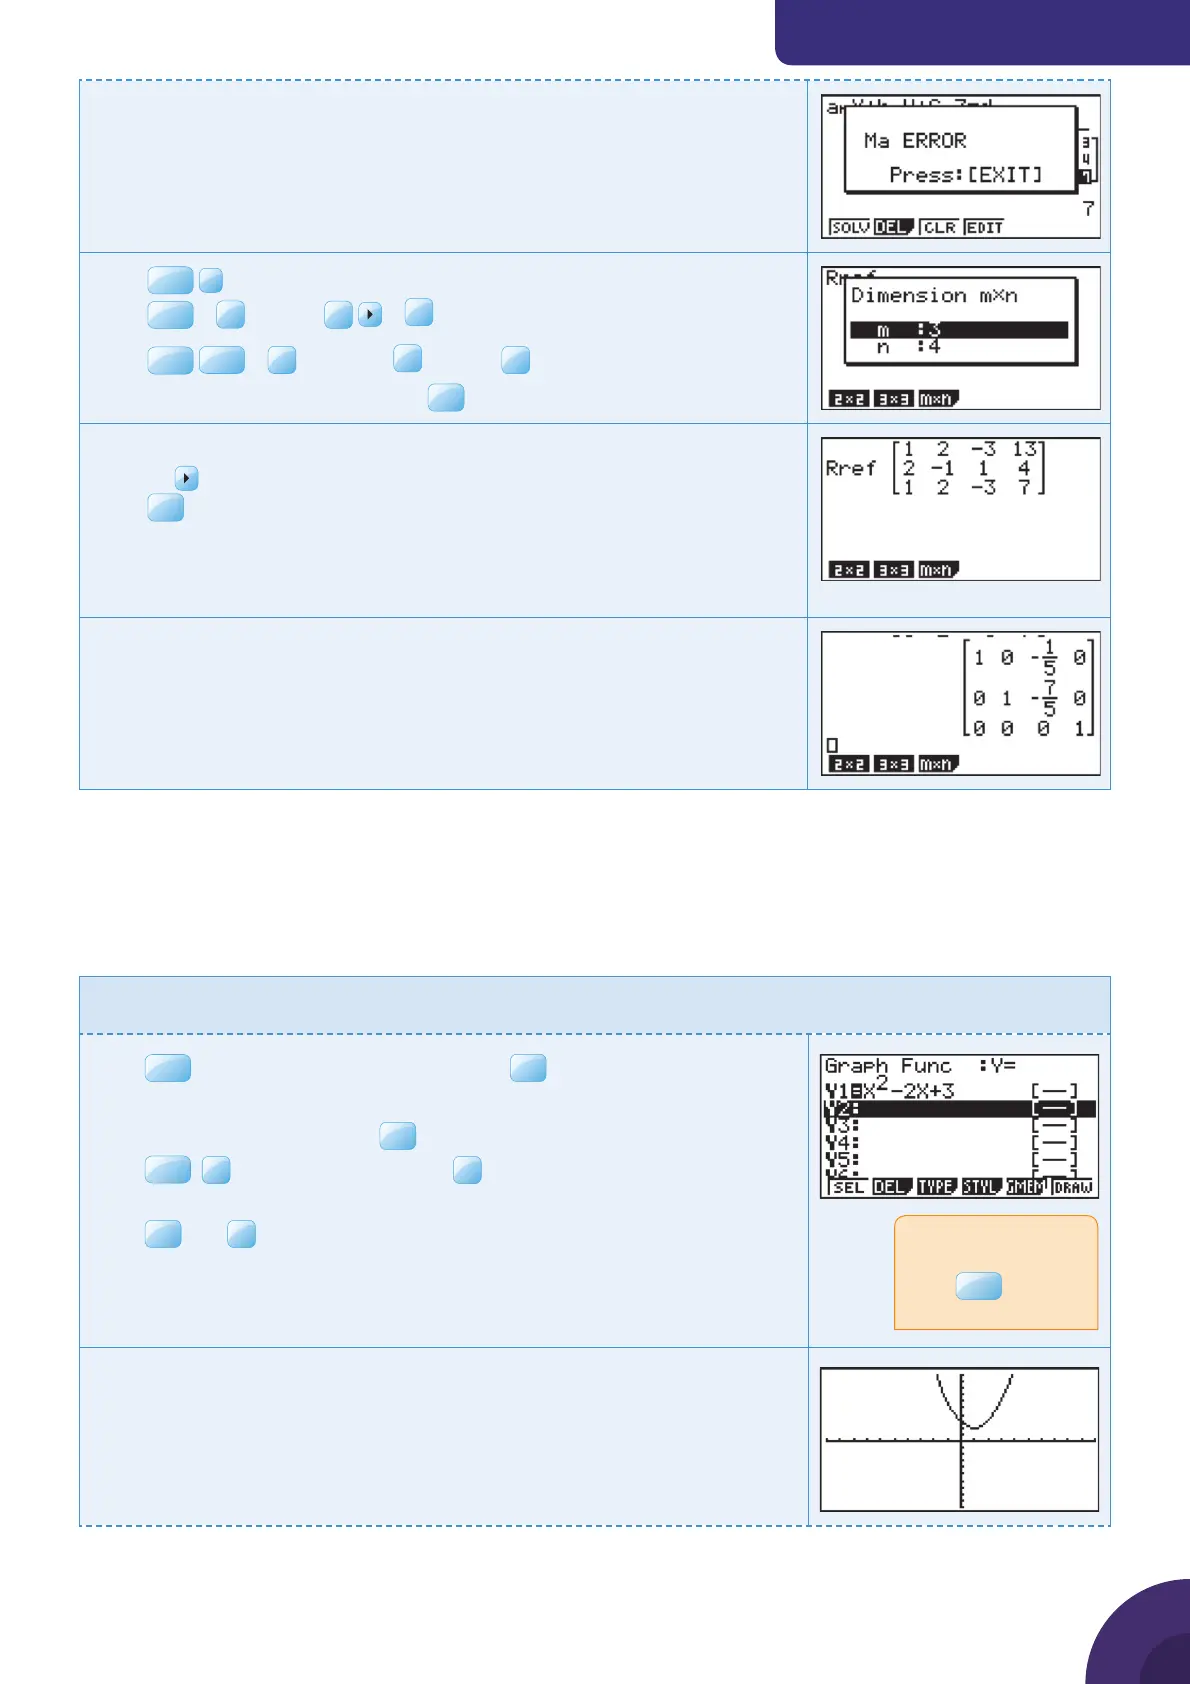
The GDC solves the equations by an inverse matrix method.
In this example there is an error because the matrix is singular,
which means that there will be no unique solution.
To fi nd the solution you can use the reduced row echelon form
method instead.
Press
MENU
1
.
Press
OPTN
|
F2
MAT |
F6
|
F5
Rref
Press
EXIT
EXIT
|
F4
MATH |
F1
MAT |
F3
m × n
Choose m as 3 and n as 4 and press
Type the coeffi cients from the three equations into the matrix,
pressing
after each number.
Press
EXE
.
The reduced row echelon form gives the solutions
to the equations of the line if the fi nal row of the
matrix is all zeroes.
There are no solutions and the fi nal row is not all zeroes.
In this example the equations are inconsistent.
Quadratic functions
1.6 Drawing a quadratic graph
Example 8
Draw the graph of y = x
2
− 2x + 3 and display it using suitable axes.
Press
MENU
and choose 5: GRAPH and press
EXE
.
The default graph type is Function, so the form Y= is displayed.
Type y = x
2
− 2x + 3 and press
EXE
.
Press
SHIF T
F3
V-Window and choose
F3
STD to use the default axes
which are −10 ≤ x ≤ 10 and −10 ≤ y ≤ 10.
Press
EXE
and
F6
DRAW.
The calculator displays the curve with the default axes.
If the calculator
displays a graph,
press
EXIT
to return
to this screen.
{ Continued on next page
9

 Loading...


