Using a graphic display calculator
© Oxford University Press 2012: this may be reproduced for class use solely for the purchaser’s institute
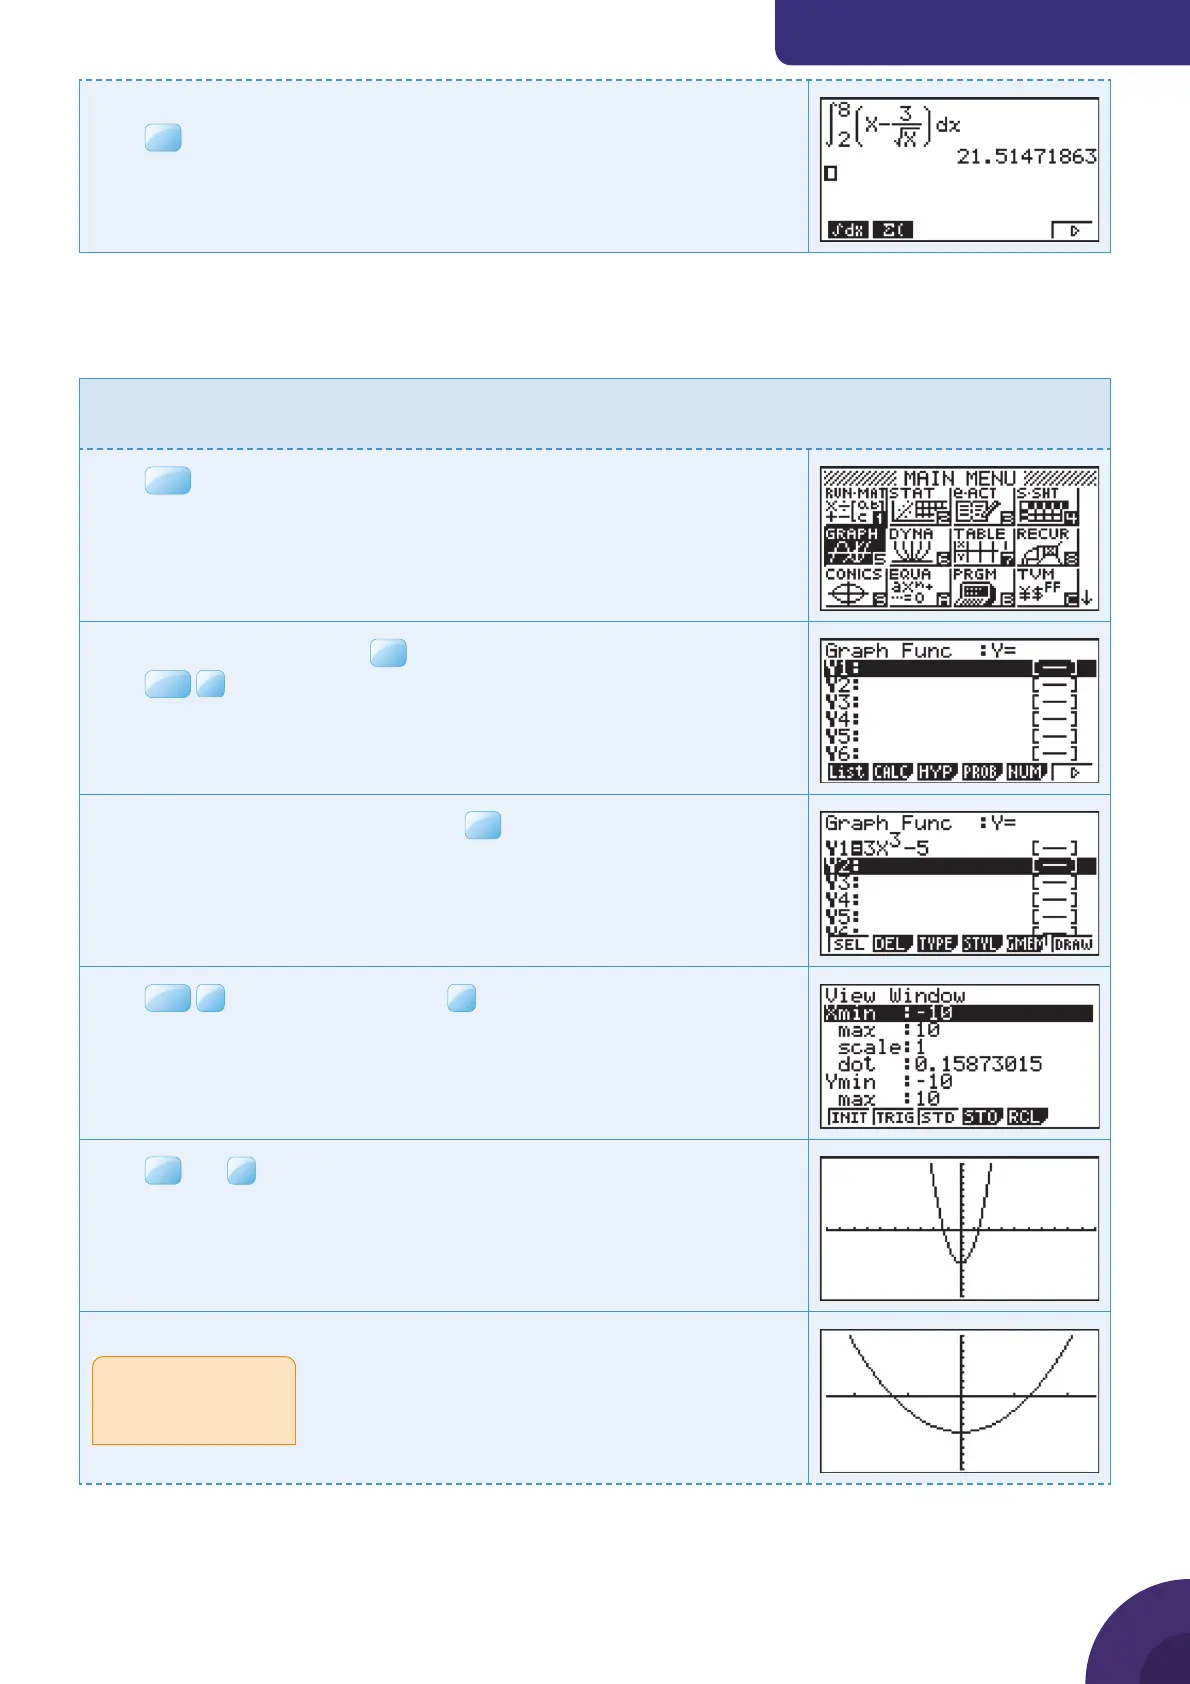
Casio fx-9860GII
Enter the upper and lower limits, the function and x in the template.
Press
EXE
.
The value of the integral is 21.5 (to 3 sf ).
3.2 Finding the area under a curve
Example 37
y = 3x
2
− 5
Find the area bounded by the curve, the x-axis and the lines x = –1 and x = 1.
Press
MENU
. You will see the dialog box as shown on the right.
Choose 5: GRAPH and press
EXE
.
Press
OPTN
Enter the function y = 3x
2
− 5 and press
Press
SHIF T
F3
V-Window and choose
F3
STD for the default axes
which are −10 ≤ x ≤ 10 and −10 ≤ y ≤ 10.
Press
EXE
and
F6
DRAW.
The graph of y = 3x
2
− 5 is displayed with the default axes.
Change the axes to make the curve fi t the screen better.
For help with changing
axes, see your GDC
manual.
{ Continued on next page
36

 Loading...


