Using a graphic display calculator
© Oxford University Press 2012: this may be reproduced for class use solely for the purchaser’s institute
Casio fx-9860GII
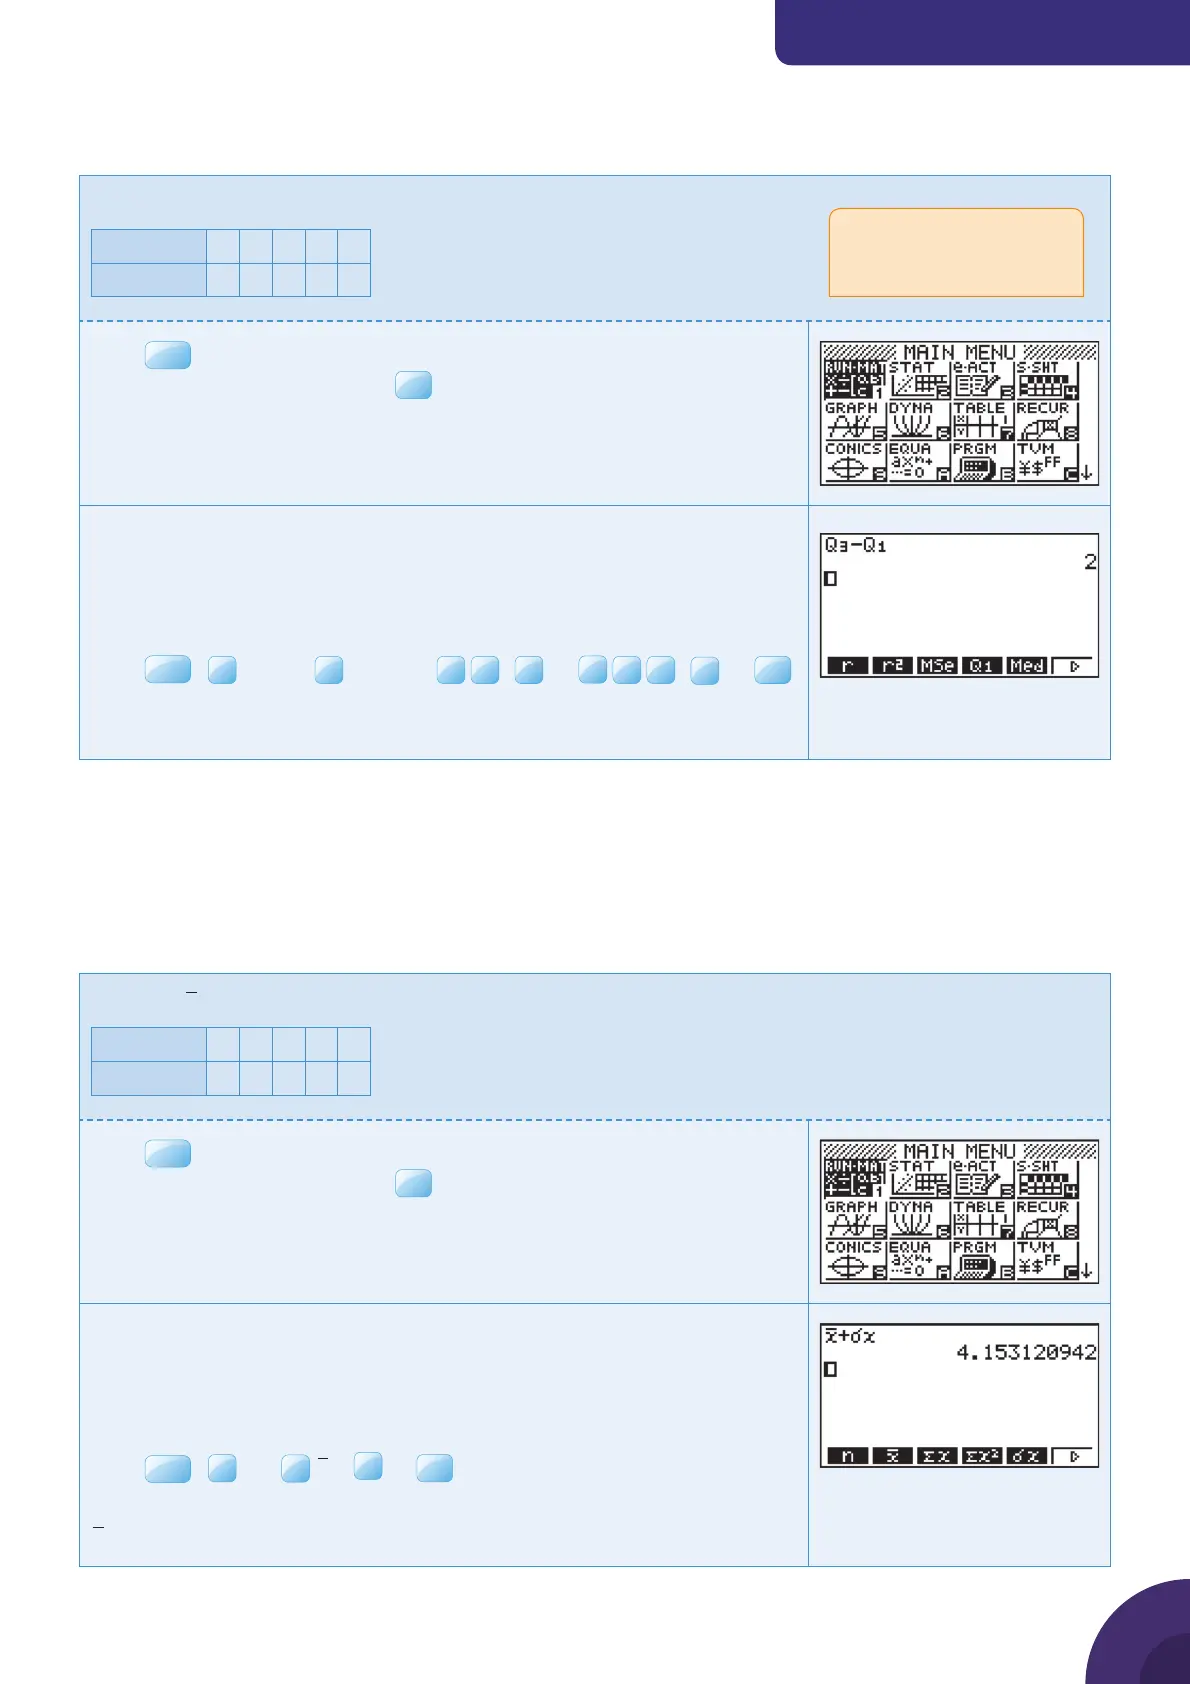
5.9 Calculating the interquartile range
Example 48
Calculate interquartile range for this data:
Number 12345
Frequency 34652
Press
MENU
. You will see the dialog box as shown on the right.
Choose 1: RUN·MAT and press
First calculate the summary statistics for this data (see Example 47).
(
Note
: The values of the summary statistics are stored after 1-Variable
Statistics have been calculated and remain stored until the next time they
are calculated.)
Press
VARS
|
F3
STAT|
F3
GRPH |
F6
F6
|
F1
Q
3
–
F6
F6
|
F4
Q
1
EXE
The calculator now displays the result:
Interquartile range = Q
3
– Q
1
= 2
5.10 Using statistics
The calculator stores the values you calculate in One-Variable Statistics so that
you can access them in other calculations. These values are stored until you do
another One-Variable Statistics calculation.
Example 49
Calculate
+ σ
for this data:
Number 12345
Frequency 34652
Press
MENU
. You will see the dialog box as shown on the right.
Choose 1: RUN·MAT and press
First calculate the summary statistics for this data (see Example 47).
(
Note:
The values of the summary statistics are stored after 1-Variable
Statistics have been calculated and remain stored until the next time they
are calculated.)
Press
VARS
|
F1
X |
F2
x
+
F5
σx
EXE
The calculator now displays the result:
+ σ
The interquartile range is the
difference between the upper
and lower quartiles (Q
3
− Q
1
).
45

 Loading...


