Using a graphic display calculator
© Oxford University Press 2012: this may be reproduced for class use solely for the purchaser’s institute
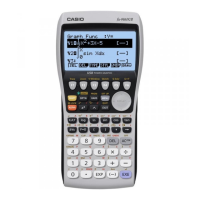
Casio fx-9860GII
5.2 Entering data from a frequency table
Example 41
Enter the data in the table:
Number 12345
Frequency 34652
Press
MENU
. You will see the dialog box as shown on the right.
Choose the 2: STAT and press
Type the numbers in the fi rst column (List 1) and the frequencies in the
second column (List 2).
Press
EXE
after each number to move down to the next cell. Press
to
move to the next column.
List 1 and List 2 will be used later when you want to make a chart or to do
some calculations with this data. You can use columns from List 1 to List
26 to enter the lists.
Drawing charts
Charts can be drawn from a list or from a frequency table.
5.3 Drawing a frequency histogram from a list
Example 42
Draw a frequency histogram for this data:
1, 1, 3, 9, 2.
Enter the data in List 1 (see Example 40).
Press
F1
GRPH and
F6
SET.
By default the graph type is Scatter Diagram (Scat). Change this to
Histogram (Hist) and leave XList as List 1 and Frequency as 1.
Press
EXIT
and press
F1
to select GPH1.
Change the start value for the histogram to 0 and the width of the bars to 1.
Press
EXE
.
A histogram, scaled for the data in the list is displayed.
{ Continued on next page
40
 Loading...


