1-14 T-Series Traffic Director Installation, Configuration and Administration Guide
Chapter 1 Introduction
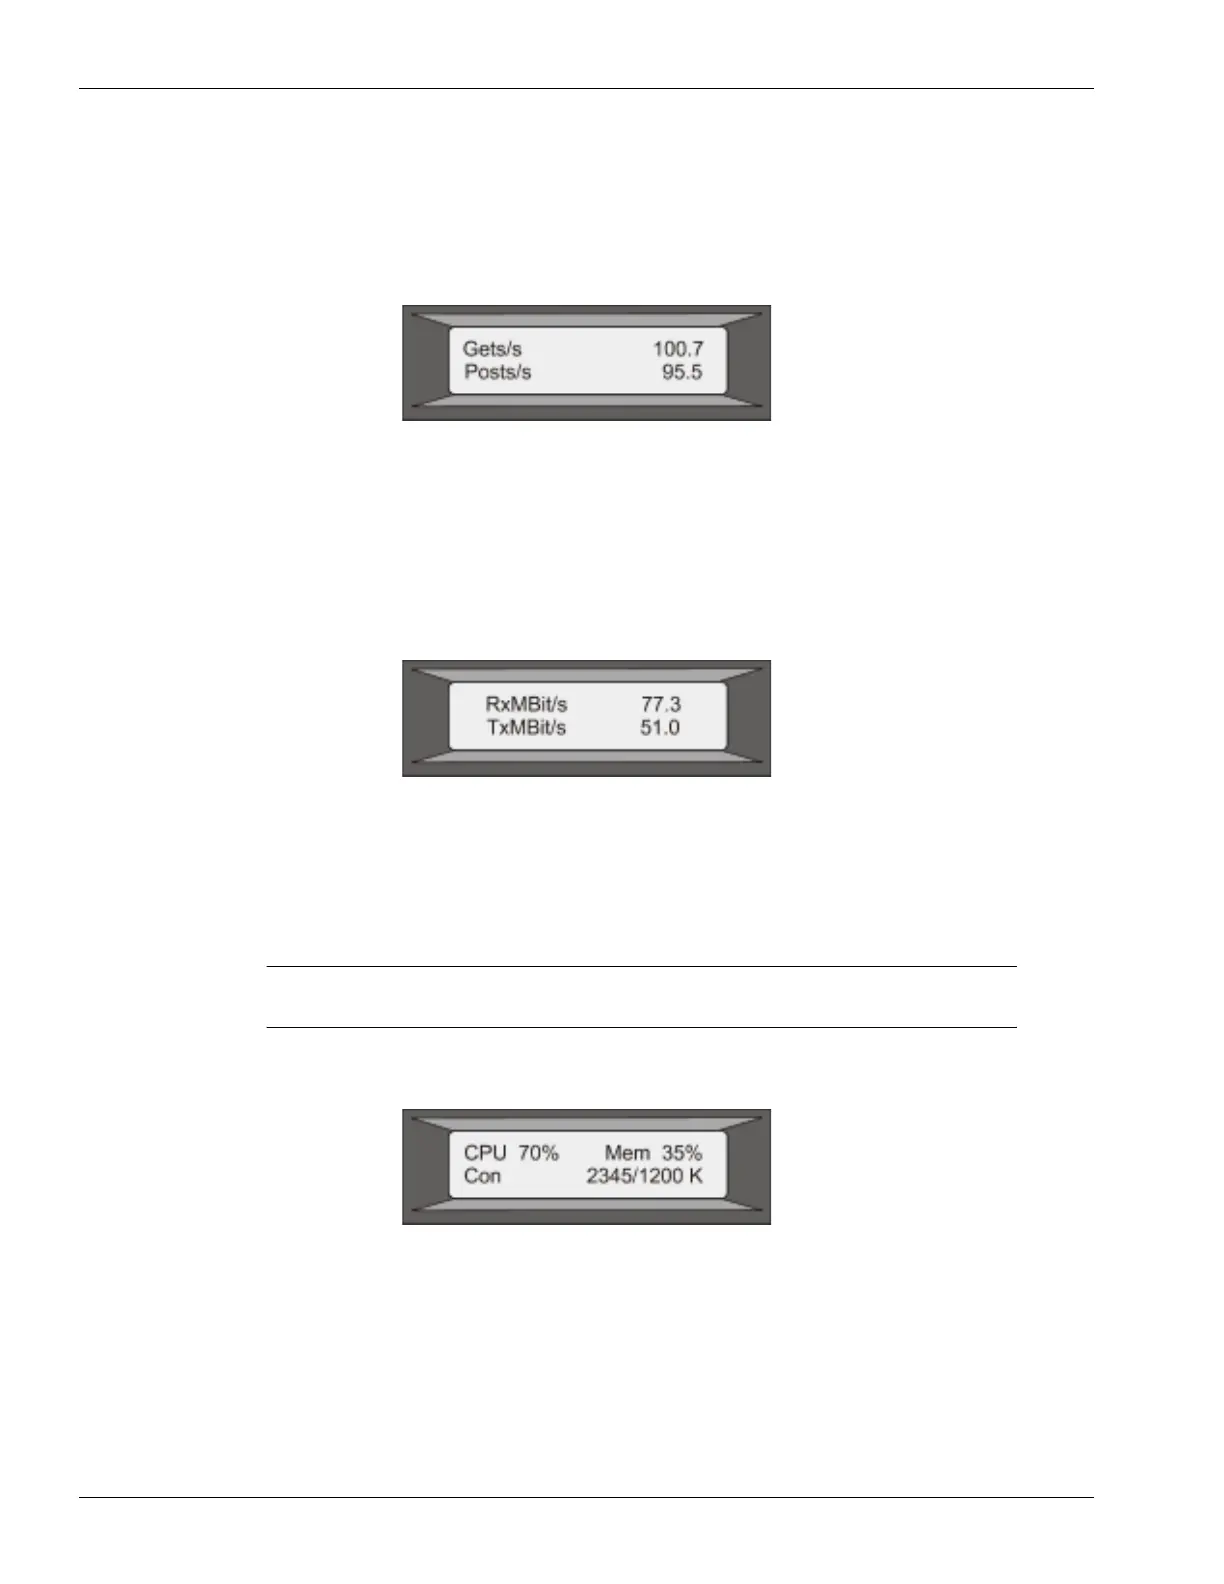
HTTP Statistics Screen.
The first line displays the rate of HTTP GETS per second. The second line displays the rate
of HTTP POSTS per second, as shown in the following figure.
Figure 1-15 LCD HTTP Statistics Screen
Network Traffic Statistics Screen.
The first line displays the rate at which data is received, in megabits per second. The second
line displays the rate of data transmission, in megabits per second, as shown in the following
figure.
Figure 1-16 LCD Network Traffic Statistics Screen
CPU Load, Memory, and Connections Screen
The first line displays CPU utilization and memory utilization as percentages. The second
line displays the ratio of the number of server connections to the number of client
connections.
Note: If the number of server or client connections exceeds 99,999, the number is
displayed in thousands, indicated by the letter K.
Figure 1-17 LCD CPU Load, Memory, and Connections Screen
Port Information Screen
The S row displays port speed, flow control, and duplex information. The R row displays
megabits received per second on the interface. The first port in each row is the management
port.
 Loading...