151
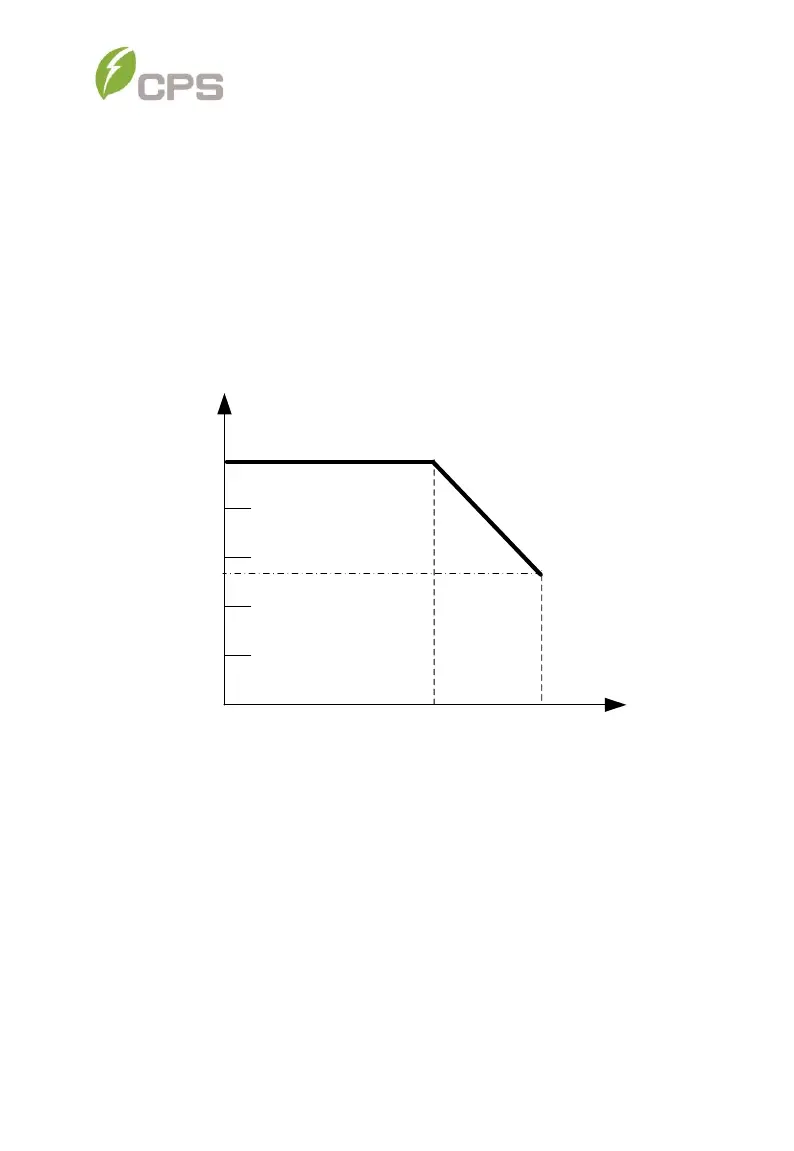
10.3 Production Graphs
The following sections illustrate the inverter production/derating in terms of
ambient temperature, altitude and grid voltage.
10.3.1 High Temperature Derating Graph
When the ambient temperature is higher than 113℉ (45℃), the inverter
output power (Pn) will begin to derate, as shown in Figure 10-1:
Pin/Pn
Tamb(℃)
45 60
100%
80%
60%
40%
20%
-3%/℃
Figure 10-1 SCA25/50/60KTL-DO/US Derating Curve with High Temperature