EasyManua.ls Logo

Dage 4000HS - Typical Xbar;Range Trend Graph

Default Icon
75 pages
Print Icon
To Next Page IconTo Next Page
To Previous Page IconTo Previous Page
Loading...
60
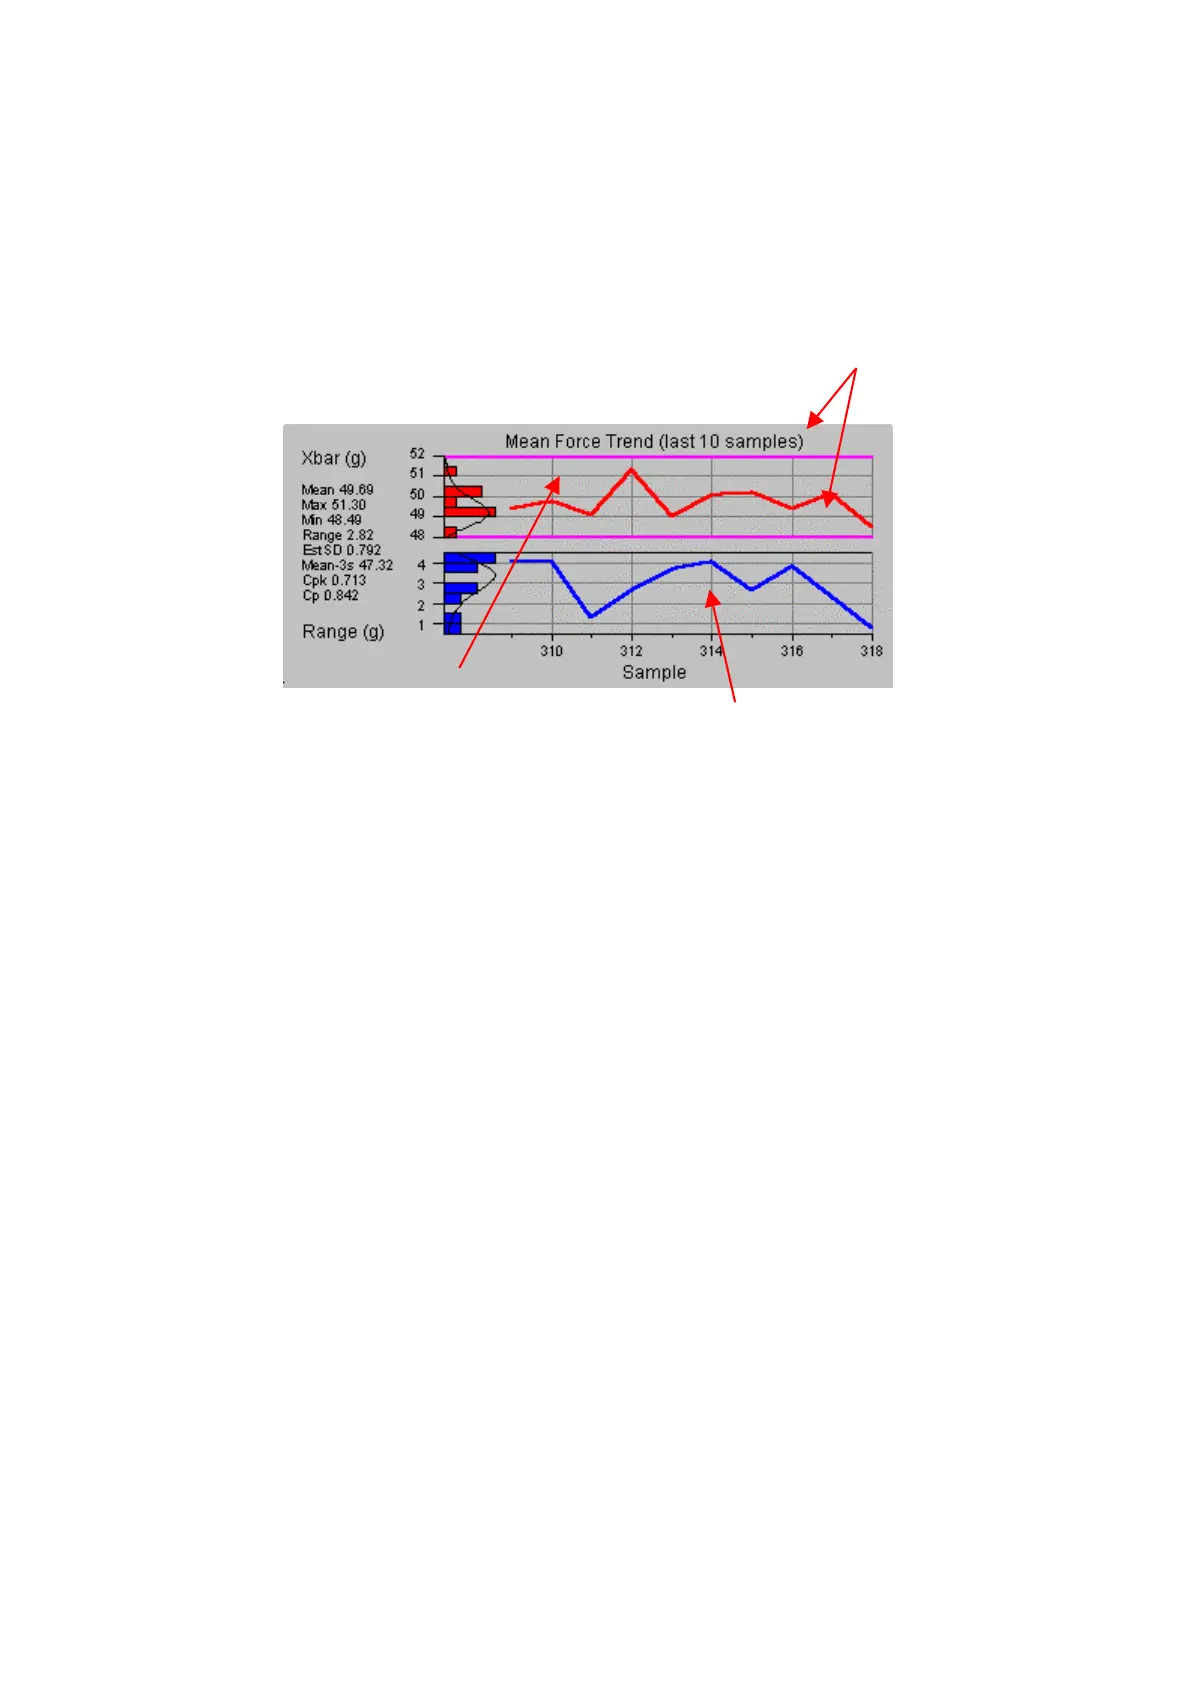
7.9.2 Typical XBar/Range trend graph
Note; many other graphs are available, speak to an engineer or your supervisor
to establish which you need to use.
Mean force of each sample
Upper and lower control limits
are shown in pink
Force range of each sample

Table of Contents

Related product manuals