01/10/2021 ASSEMBLY INSTRUCTIONS MLD Control EC-6 with CCB III Page 17
4.1.3 Display Interface:
In this section, information will be provided on different options of our DEGER wind monitor software:
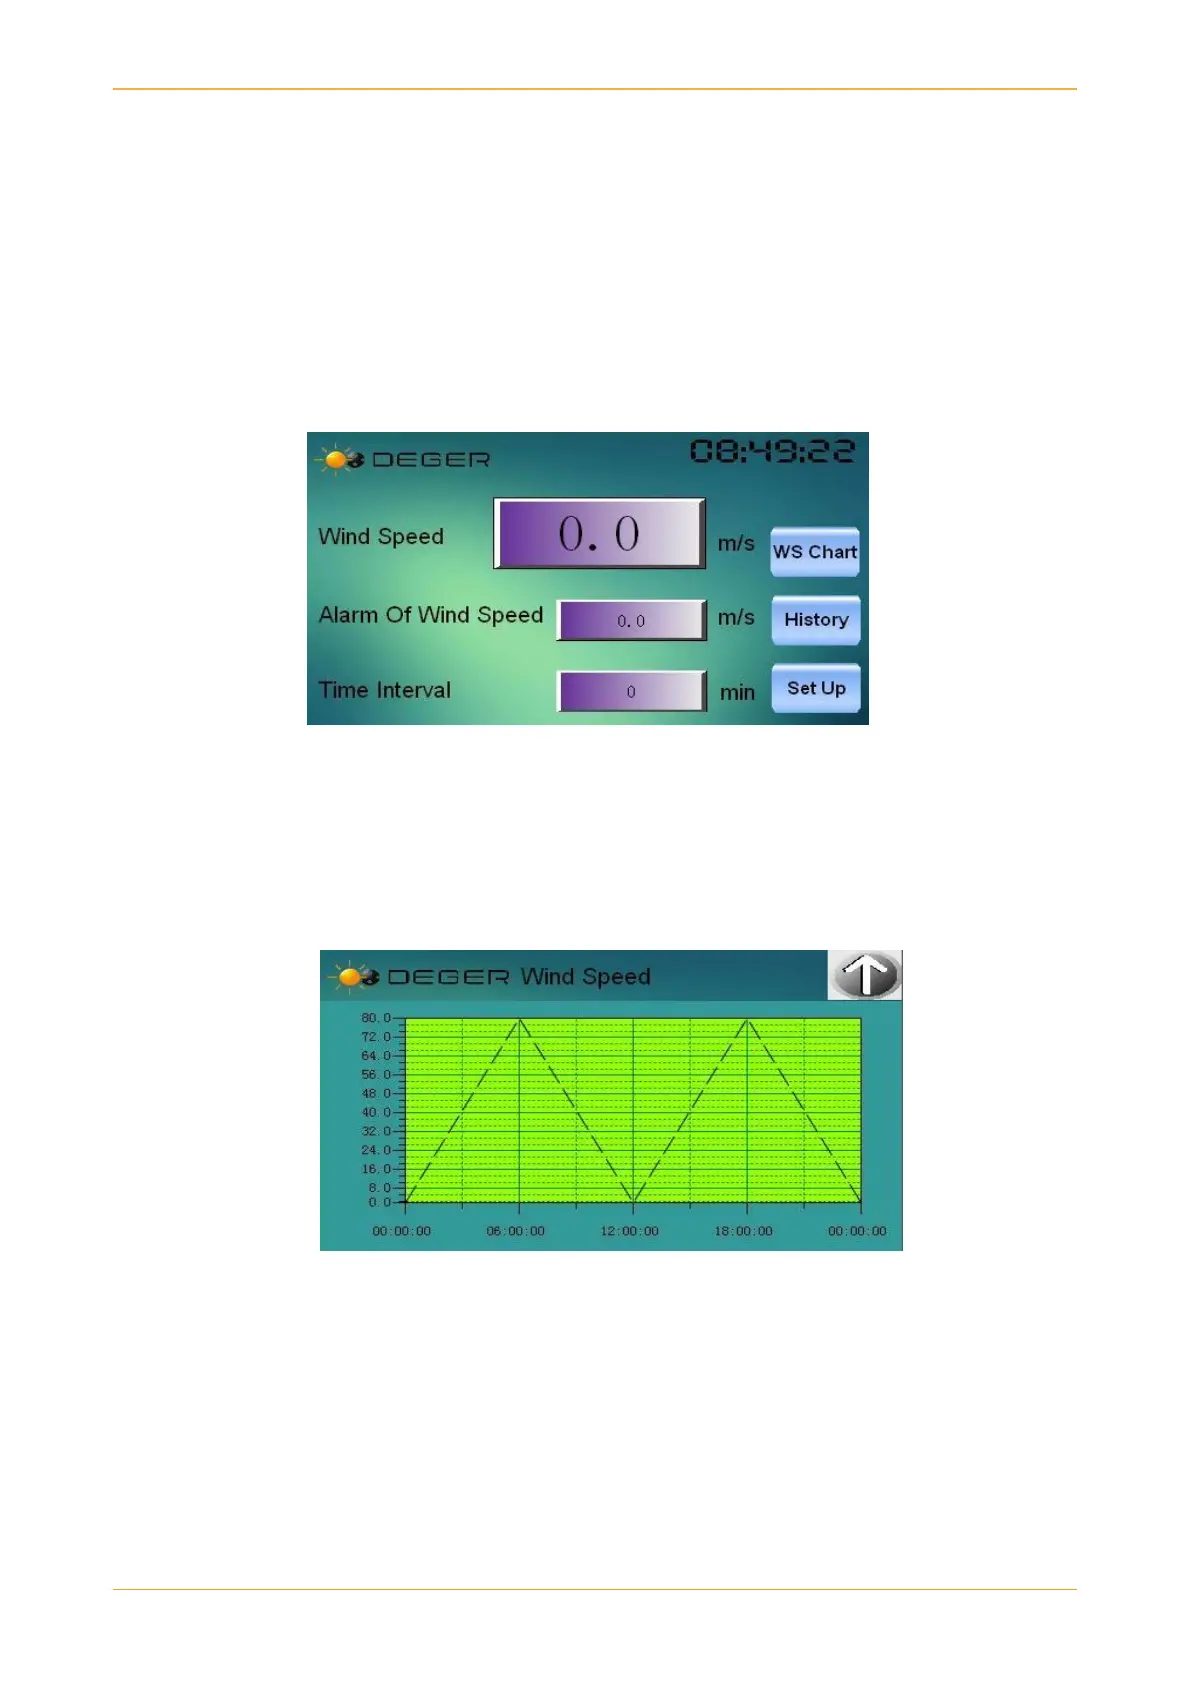
Main Interface: The main interface shows the following information:
a. Wind Speed: It shows the wind speed from rotation of anemometer in m/s.
b. Alarm of Wind Speed: Shows the wind speed at which the alarm will start and the tracker
will move to safe position.
c. Time Interval: This shows after how many minutes it stores the data.
d. WS Chart: This shows the user a graph of wind speeds over the whole day.
e. History: This shows the saved wind speeds at different times of the day.
f. Set Up: It has more options to choose from which will be discussed later.
Main Interface
Note: The alarm of wind speed and time interval is locked with a password. This can only be set by
a DEGER team member.
Wind Speed Chart Interface: When user clicks on WS Chart button, they will see the graph shown
below.
WS Chart
As seen above the graph shows different wind speeds on vertical axis and the corresponding time
shown on horizontal axis of graph.