Multec 3.5 Fuel Injector Application Manual Fundamentals
Delphi Energy and Chassis Systems
Revision: 11/05-1 2-13
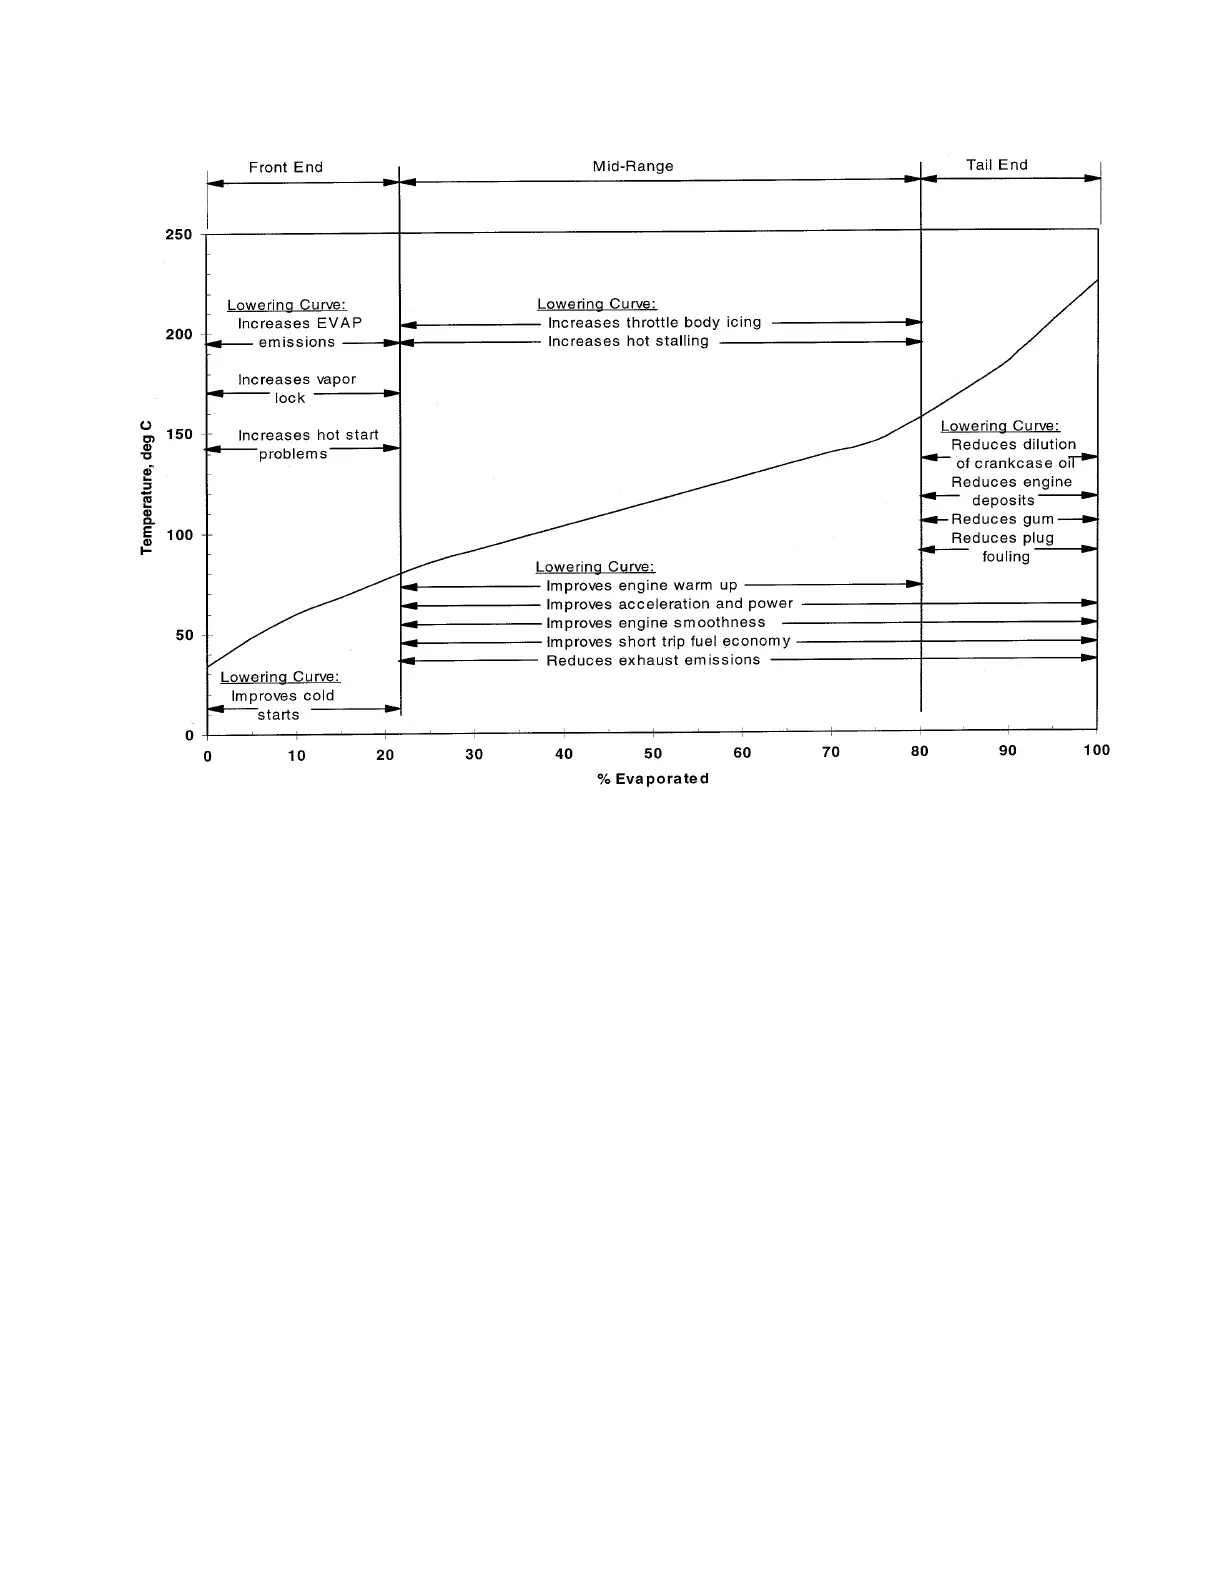
Figure 2-3 - Fuel Distillation Curve vs Temperature
2.2.6.4 Driveability Index
A more complete understanding of the impact of fuel volatility on fuel
system performance can be obtained by measuring the fuel’s distillation
curve and computing the driveability index (DI). Figure 2-3 shows a fuel
distillation curve and which aspects of engine performance are impacted
for a typical gasoline.
DI = 1.5T
10
+ 3T
50
+T
90
where T
10
, T
50
, T
90
are the 10%, 50% and 90 %
evaporated temperatures measured by ASTM D86. Temperatures are
specified in °F.
AAMA and ASTM proposed limits for DI are 1200 to 1290 max. DI
values exceeding these limits have been documented to produce customer
dissatisfaction due to reduced driveability.