Chapter 2 Engineering Design of Servo Mechanism
17
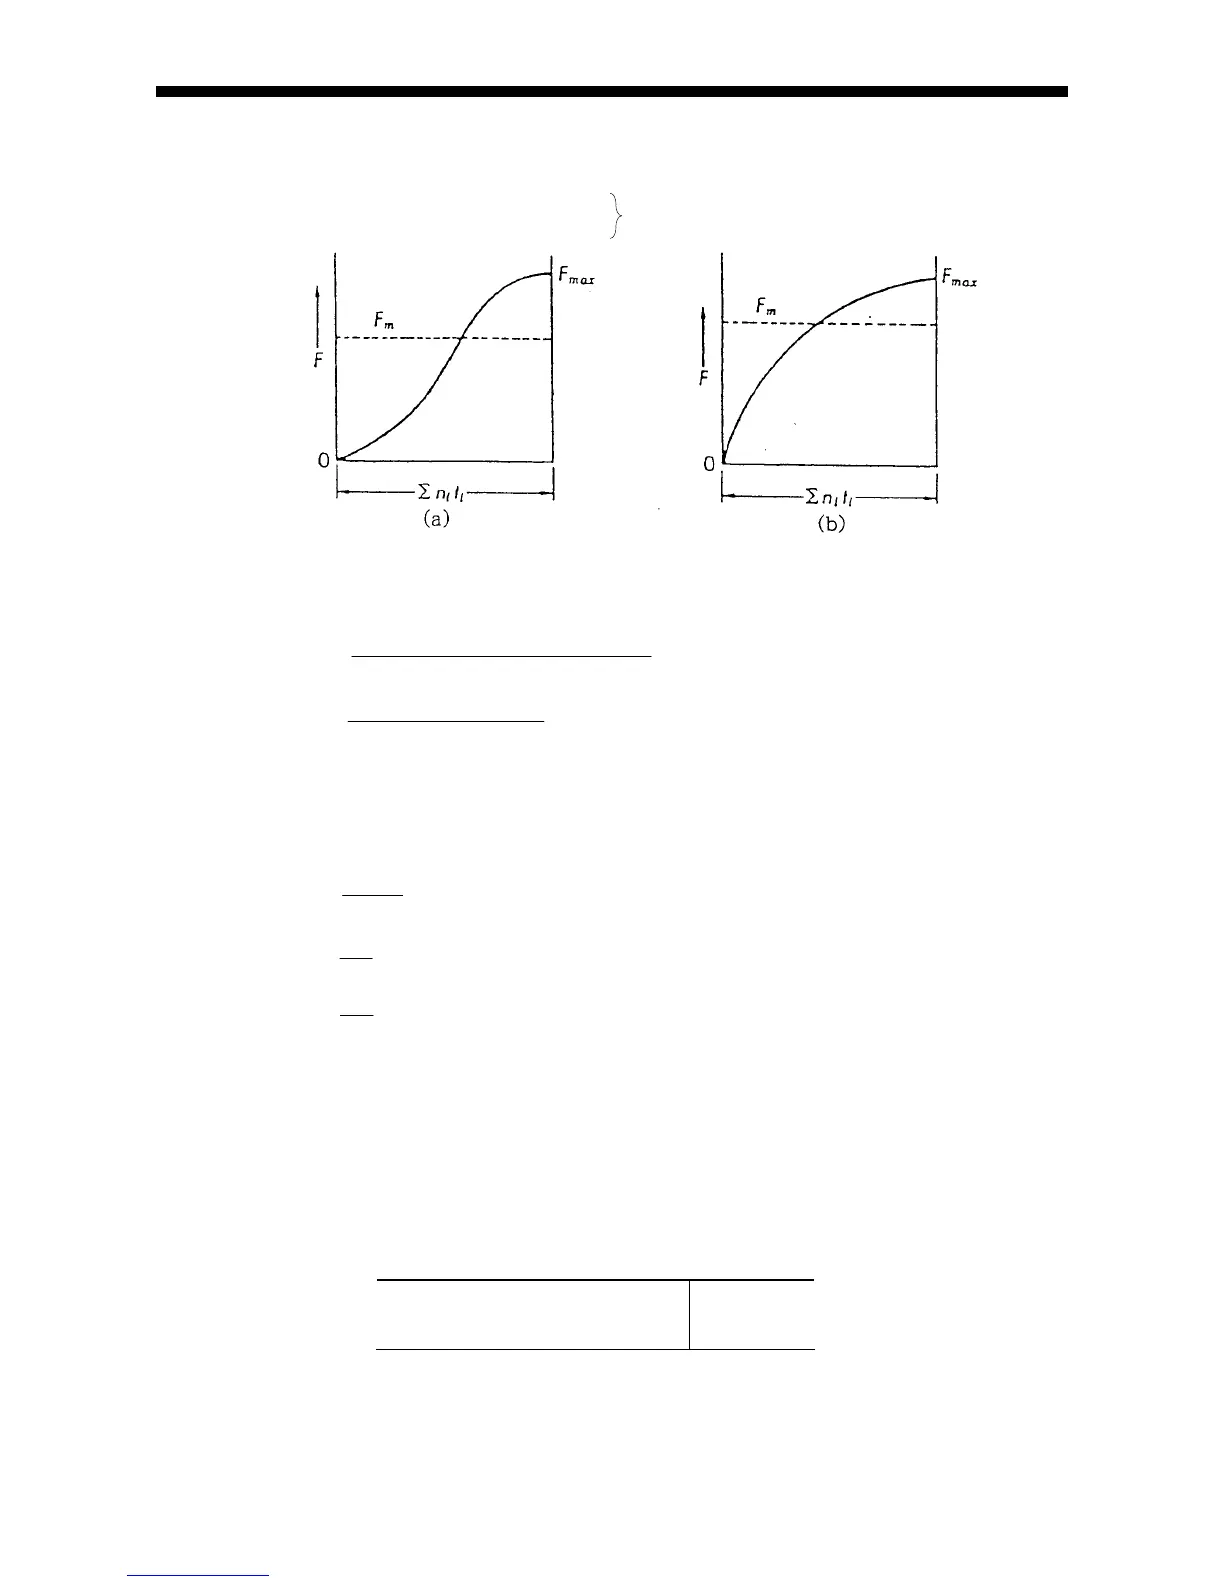
(c) When load is changed like a sine curve (Fig. 2-7)
Average load F
m
can be approximately achieved by the following equation.
Fig. 6 In case of (a) F
m
≒0.65F
max
In case of (b) F
m
≒0.75F
max
Fig. 2-7. Sine-curvedly changing load
Therefore, from equation (3), (4)
F
FNt FNtFNt
Nt Nt Nt
g
abc
abc
m
1
3
12
3
2
3
3
3
123
13/
1200 (rpm)
4-2) Life calculation
Fatigue life is generally shown by total rpm. Sometimes it is shown by total rotation time or
total running distance. Fatigue life can be achieved by the following equation.
L
Ca
Fa f
w
10
6
······························································································ (7)
Lt
L
n
60
············································································································· (8)
Ls
Ll
10
6
············································································································· (9)
Where L: Rated fatigue life (rev)
Lt: Life time (hr)
Ls: Running distance life (km)
Ca: Basic dynamic load rating (N)
Fa: Shaft direction load (N)
n: Speed (rpm)
l: Lead (mm)
f
w
: Load coefficient (coefficient by operating condition)
Smooth running without shock 1.0 - 1.2
Normal running 1.2 - 1.5
Running with shock/vibration 1.5 - 3.0
··············································· (6)