21Chapter 3: Home Screen Overview 21
Dexcom G6
®
System • Using Your G6
3.2 G6 Reading, Trend Arrow, and Graph
Where You Are Now
On the home screen, numbers and color tell you where you are now. The number is
your G6 reading. It updates every 5 minutes. The number background color shows
whether your G6 reading is low, high, or in your target range.
Where You Are Going
To know where you are going, look at your trend arrows.
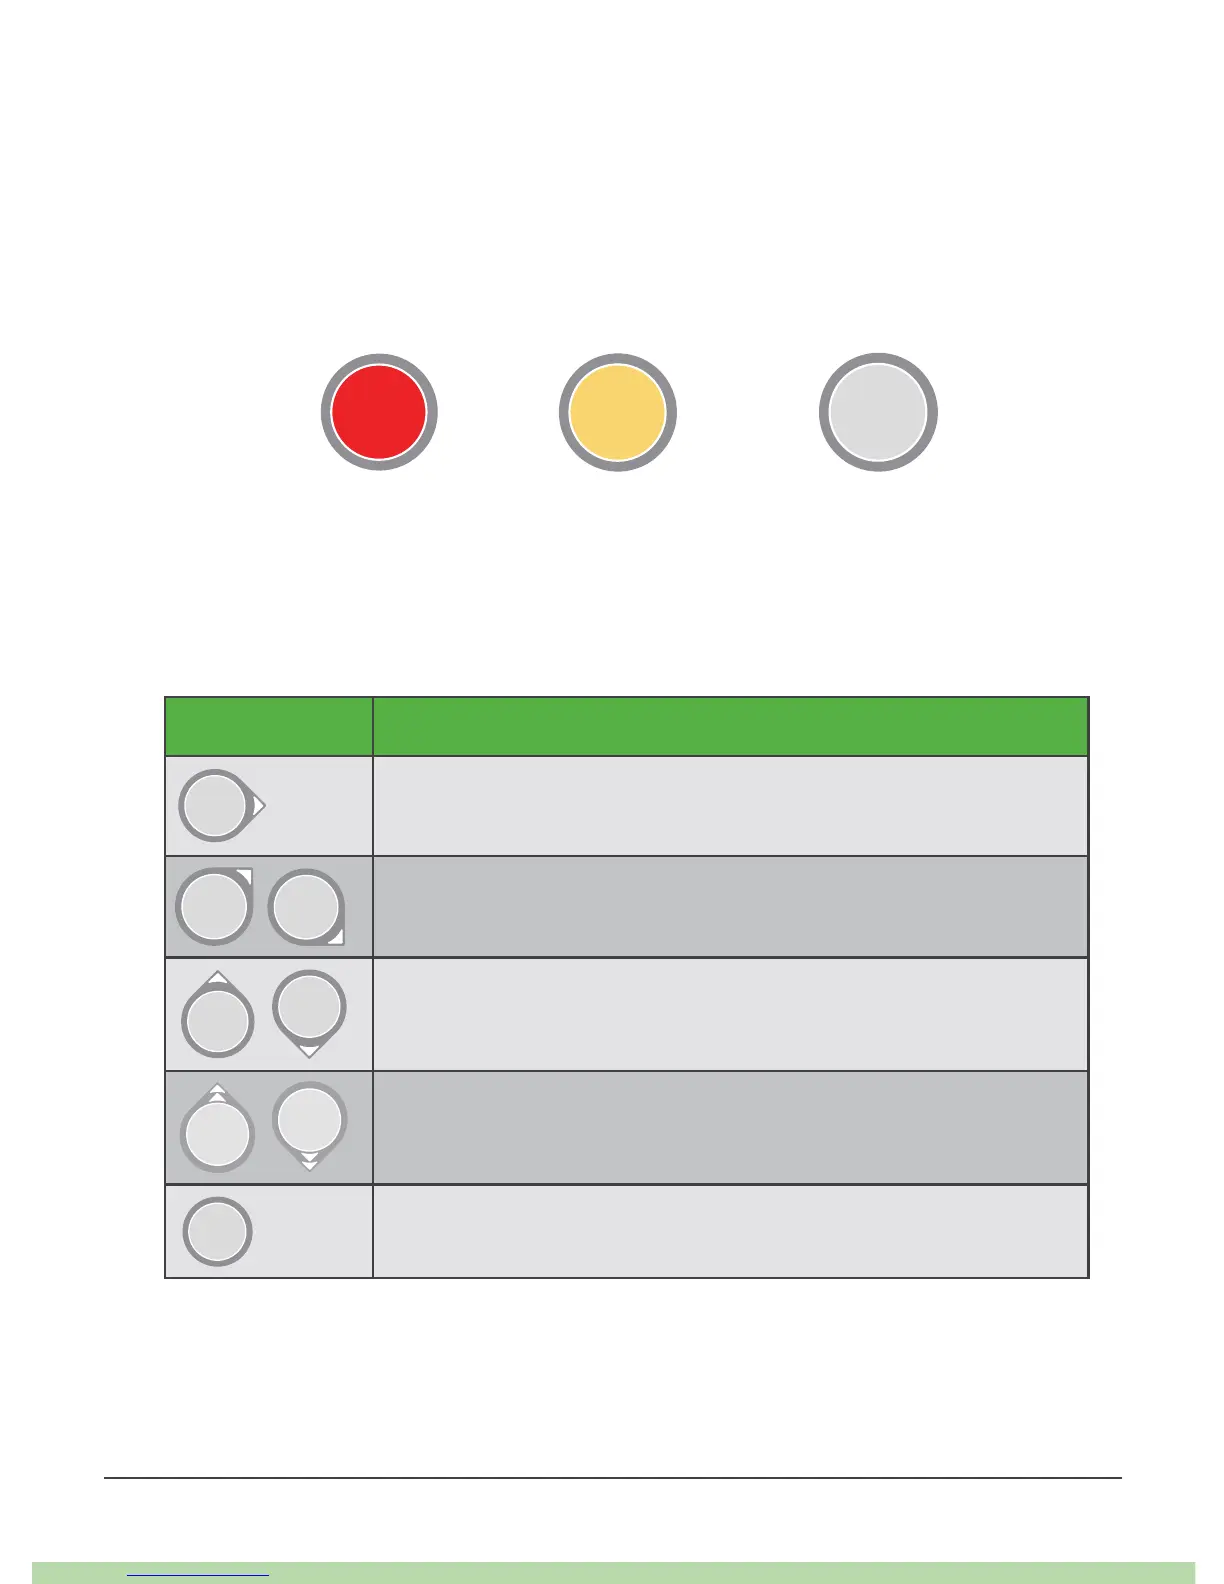
Trend Arrows Where Your Glucose Is Going
Steady
Changing less than .06 mmol/L each minute
Slowly rising or falling
Changing .06–.11 mmol/L each minute
Rising or falling
Changing .11–.17 mmol/L each minute
Rapidly rising or falling
Changing more than .17 mmol/L each minute
No arrow
Cannot determine trend