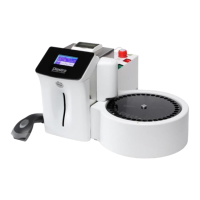
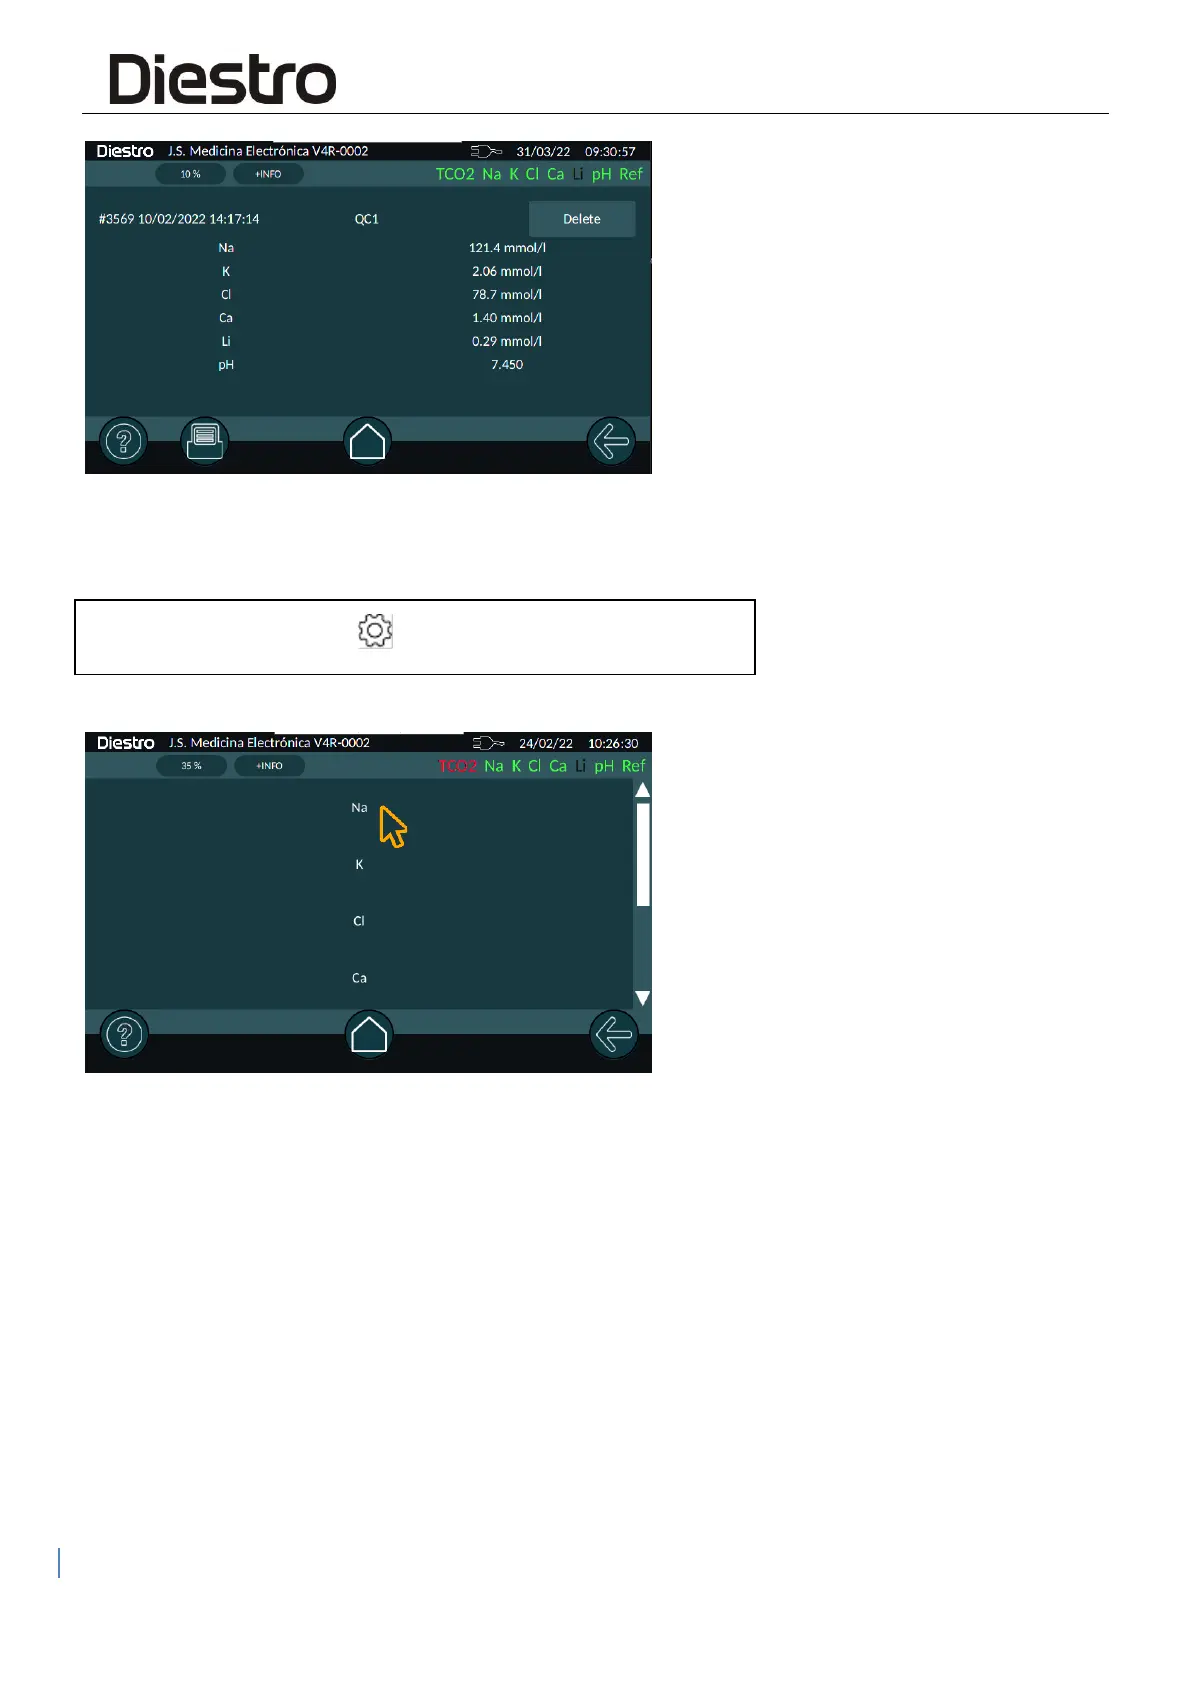
Pressing the chosen analyte shows a graph where you can see the evolution of the
measurements, the limits for that control, and the standard deviations represented with
horizontal dotted lines for +/- 1, +/- 2 and +/- 3 standard deviations.
With the drop-down list you can choose the number of samples that will be used to make the
graph. It can be the last 6, 20, 30, 40 or 50 measurements.
 Loading...