8-22
Panel Operation, continued
Parameter data
plot (continued)
Action... Result...
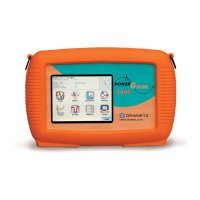
Once View Limits is selected,
threshold values crossed that
cause the V RMS Imbalance
event are displayed on screen.
MARK612
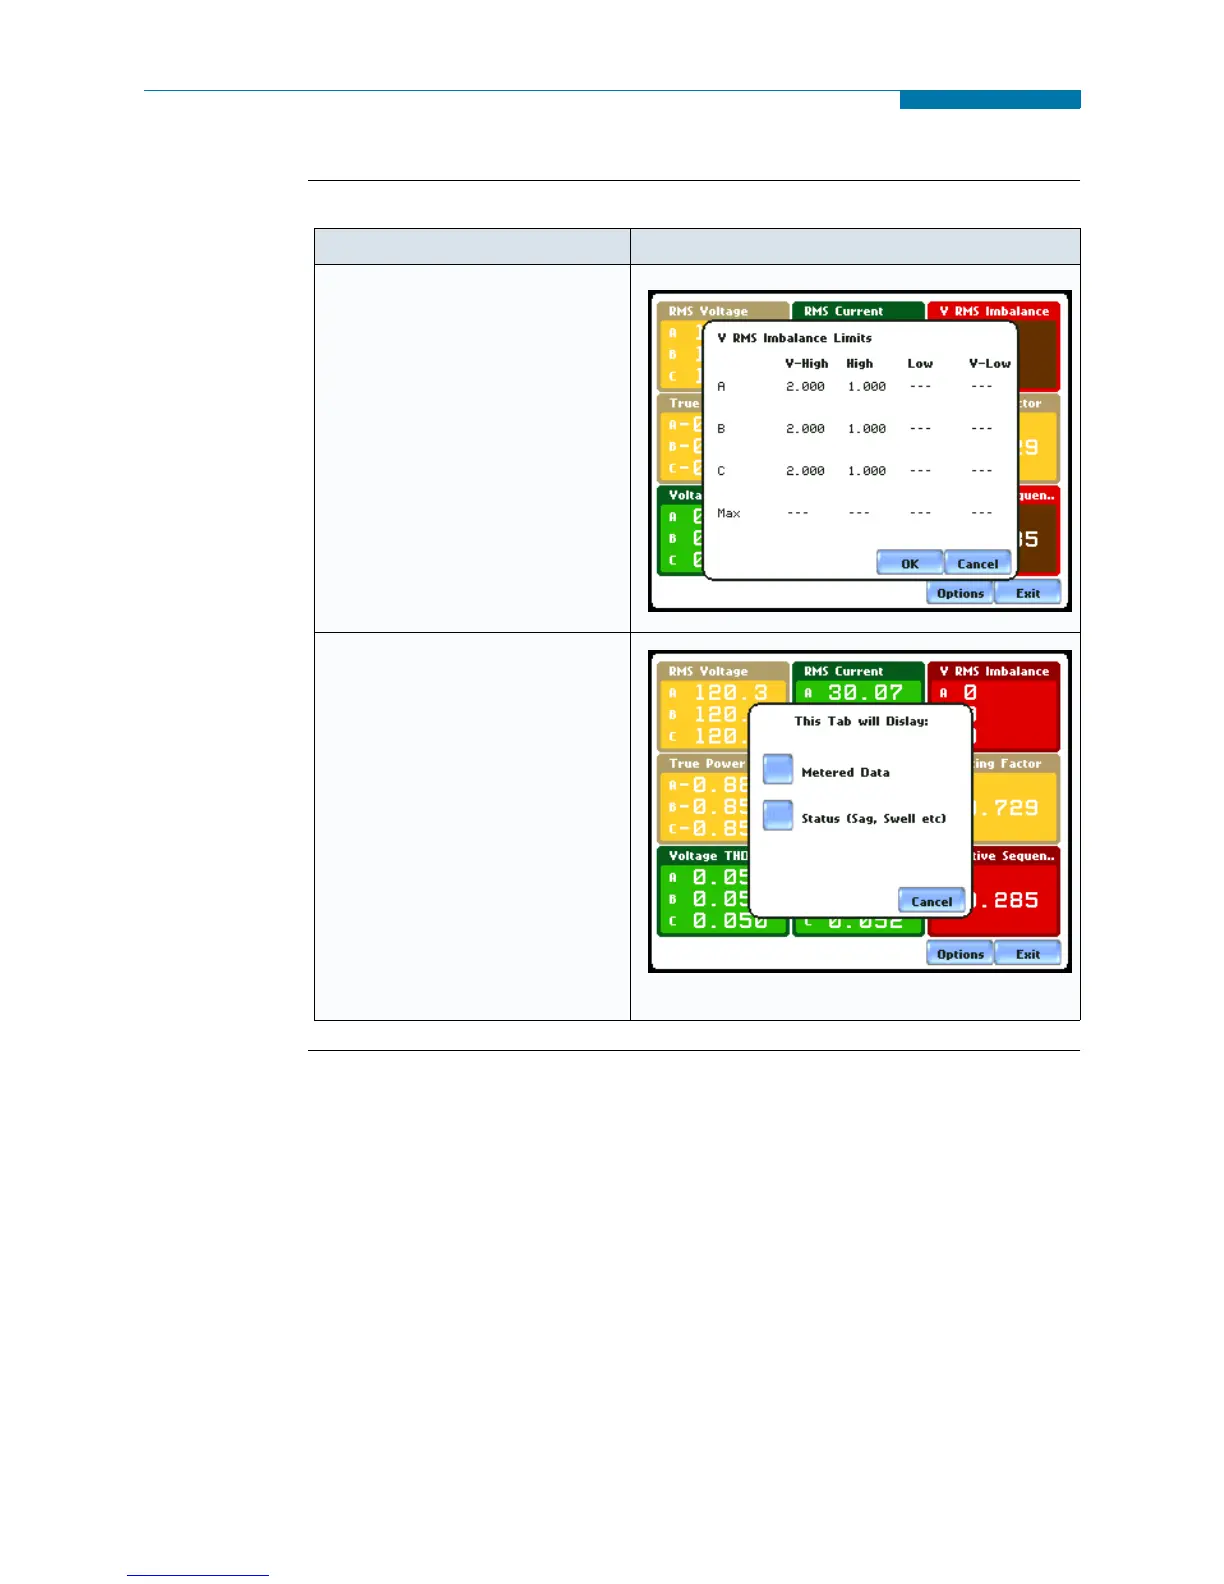
Once Edit panel is selected, the
window where you can select
Metered Data journal categories
to plot is displayed.
You can also view the trend plot
for sag, swell, and transient by
pressing the Status button.
MARK613
www.GlobalTestSupply.com
Find Quality Products Online at: sales@GlobalTestSupply.com
 Loading...