Web Configuration
3-9
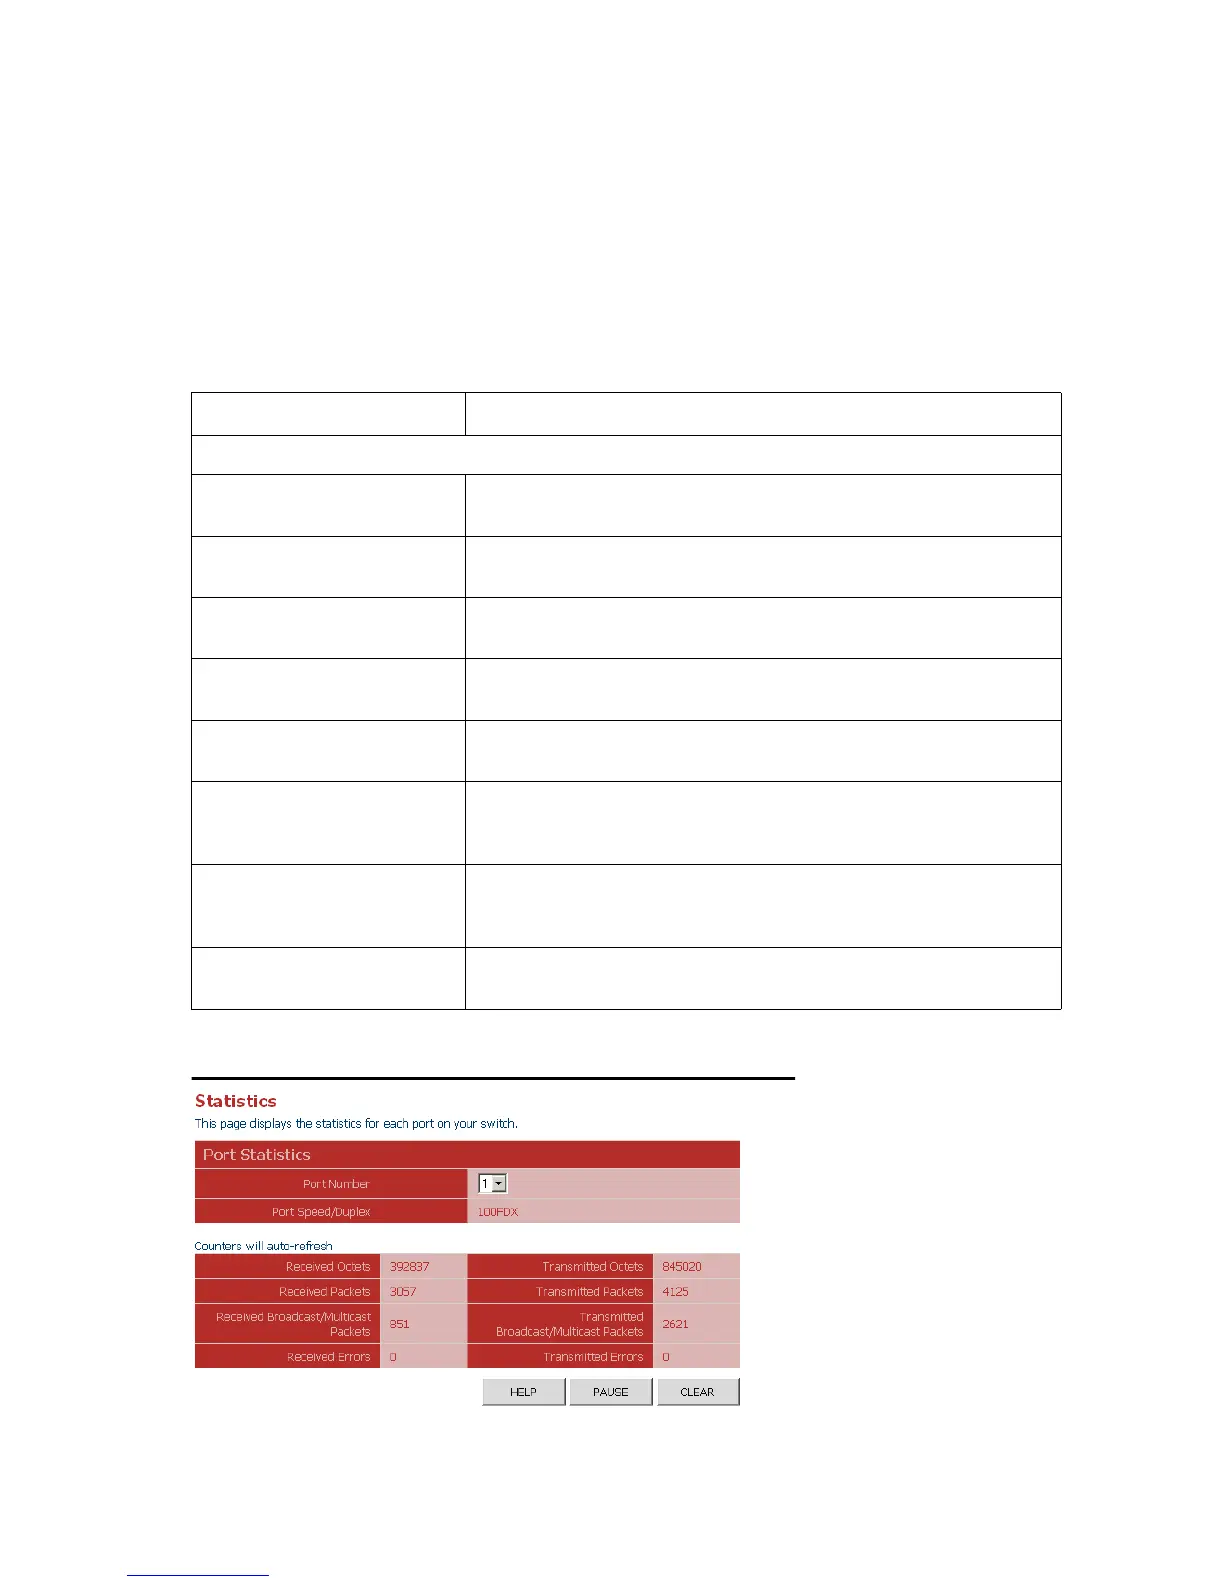
Showing Port Statistics
You can display statistics on network traffic from the ports. These statistics can be
used to identify potential problems with the switch (such as a faulty port or unusually
heavy loading). All values displayed have been accumulated since the last system
reboot, but can be reset to zero by clicking the CLEAR button. The current statistics
are refreshed every few seconds, but the refresh can be paused by clicking the
PAUSE button.
Web – Click STATUS, Statistics.
Figure 3-4 Port Statistics
Table 3-3 Port Statistics
Parameter Description
Interface Statistics
Received Octets The total number of octets received on the interface, including framing
characters.
Received Packets The number of subnetwork-unicast packets delivered to a higher-layer
protocol.
Received Broadcast/Multicast
Packets
The number of packets, delivered by this sub-layer to a higher (sub-)layer,
which were addressed to a multicast address at this sub-layer.
Received Errors The number of inbound packets that contained errors preventing them
from being deliverable to a higher-layer protocol.
Transmitted Octets The total number of octets transmitted out of the interface, including
framing characters.
Transmitted Packets The total number of packets that higher-level protocols requested be
transmitted to a subnetwork-unicast address, including those that were
discarded or not sent.
Transmitted Broadcast/Multicast
Packets
The total number of packets that higher-level protocols requested be
transmitted, and which were addressed to a multicast address at this
sub-layer, including those that were discarded or not sent.
Transmitted Errors The number of outbound packets that could not be transmitted because
of errors.