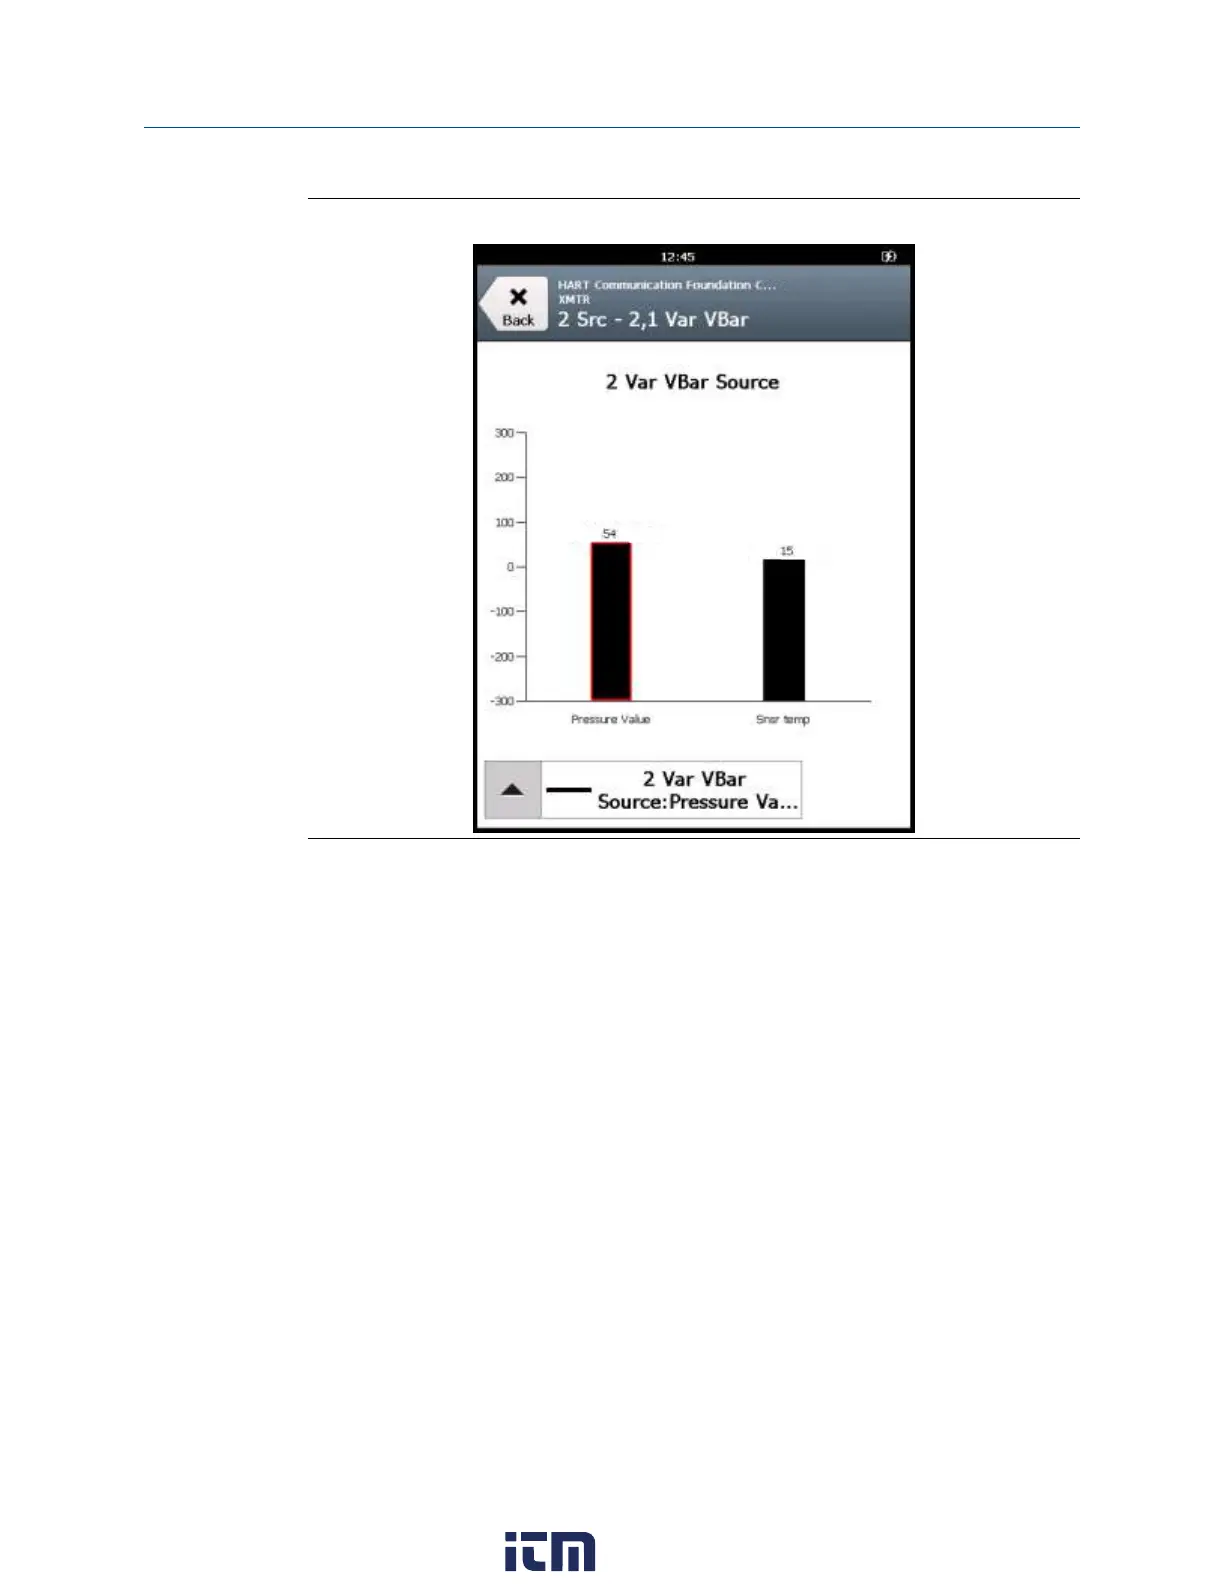
Figure 3-49: Vertical bar chart
3.26.6 Gauge charts
A gauge chart formats device data into a view similar to an analog car speedometer and
plots device data varying with time. Use the drop-down list to select the variable you want
to highlight. Additional gauge needles may be present if more than one variable is defined.
The selected variable from the drop-down list appears as a long, colored needle while the
other variables appear as short, colored needles. The colors displayed are determined by
the device description and may vary between devices. A gauge chart can have up to three
variables. The labels and axis displayed are determined by the device manufacturer.
The chart update rate is determined by the device manufacturer. The default chart update
rate is 1 second.
User Guide Field Communicator application
September 2021
User Guide 121
w ww . . co m
information@itm.com1.800.561.8187
 Loading...