Equil
TM
Insulin Patch Pump System
12.1.2 Graph Display
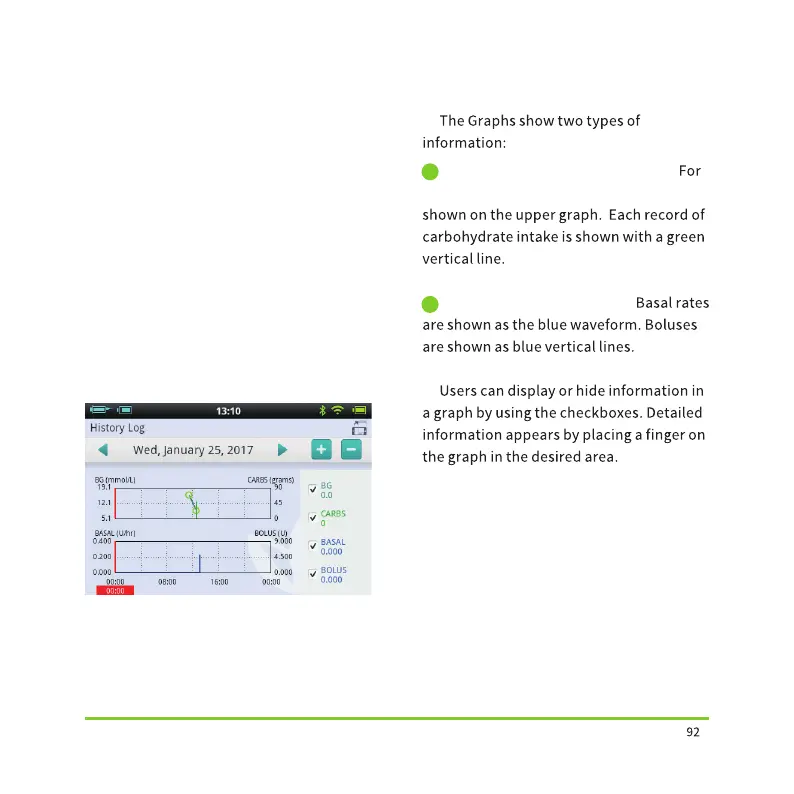
Figure 109
Blood Glucose/Carbohydrates:
Insulin Delivery Amount:
1
2
The grey area shows time-stamped
event entries such as BG readings, changes
in Basal Rate and Bolus amounts. You can
use your finger to scroll up and down
through the list. You may also filter the
results by using the check boxes beneath
the list.
If you hold the PDA in landscape
orientation, daily information will be
displayed in a Graph Display mode (Figure
109).
each blood glucose test reading, a circle is