DAZZLER
TM
system manual Part I : installation & operation 4.1
• item-2 The acousto-optic transducer, being non-transparent, is not situated on the opti-
cal input face, but on a side of the Dazzler crystal (Figure 3.4). Hence the acoustic pulse
needs time to propagate from the transducer to the optical input face.
• (item-3) After the reflection, the acoustic pulse still needs to travel between the optical
input and output faces (a few tens of µs , depending on the crystal cut and length). This
propagation time is displayed in the TXtal indicator.
The propagation times item-1 and item-2 are lumped in the T
p
indicator. The delay between
the start of the RF generation to the optical event is: T
p
+ TXtal . T
p
and TXtal are parameters
given to the Dazzler
TM
software. Synchronization of the optical event(pulse) can be obtained
based on:
• the propagation of light in the crystal is instantenous
• the duration of the acoustic wave is less or equal to TXtal
• there is enough ’early’ warning time: Trigger to Laser >= T
p
+ TXtal
• starting RF generation in advance so that the acoustic (RF) wave is fully in the crystal,
without clipping
• a less demanding condition is possible when starting the RF cycle by the delayed previ-
ous trigger pulse
4
. This mode of operation is called Trig on Previous mode, see subsec-
tion 4.3.2.
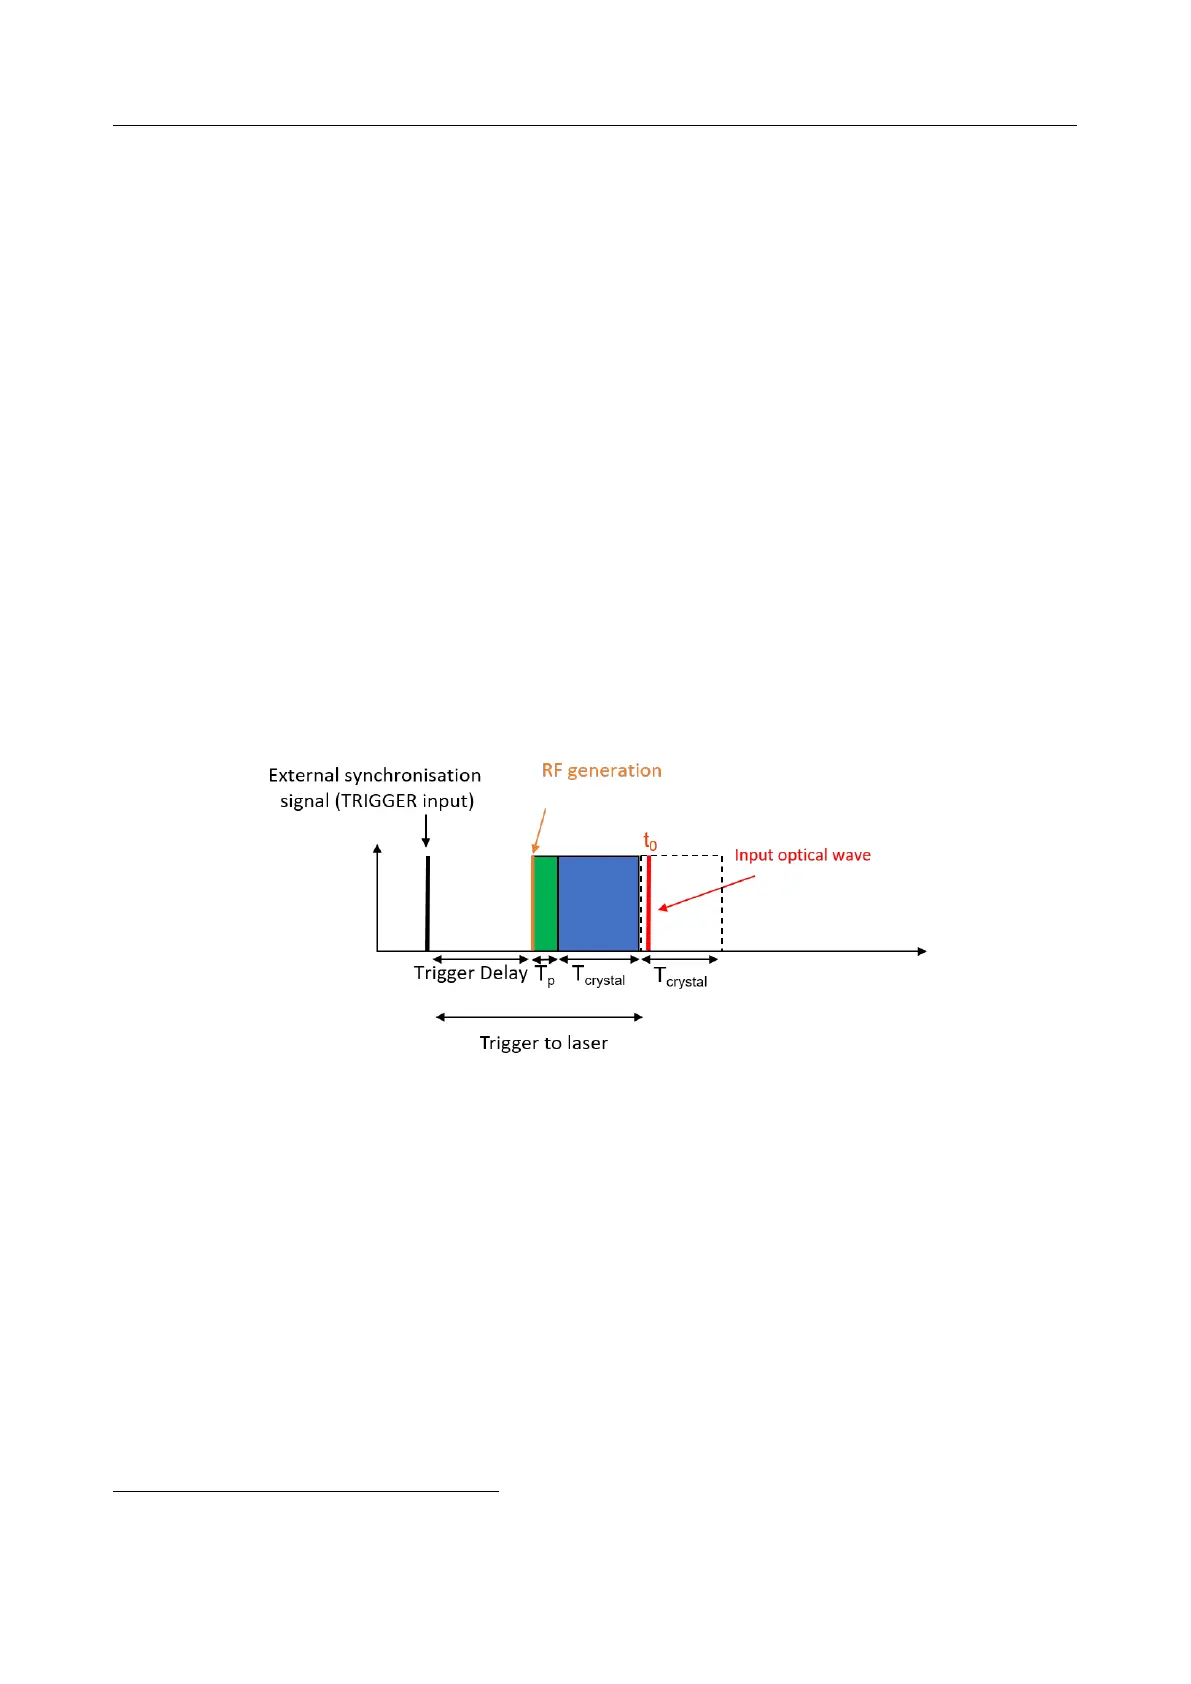
Figure 4.1: Optimum trigger settings
Figure 4.1 shows when these conditions are fulfilled, resulting in a positive Trigger Delay .
With these settings, the acoustic wave is fully contained in the crystal when the optical wave
goes through.
To illustrate the effect of Trigger Delay , one uses the software time and spectrum graphs (see
subsection 5.1.5). The spectrum (a.u. vs nm) graph represents the amplitude response of the
filter (|H(ω)| defined in section 2.1.3). The black curve represents the programmed spectral
amplitude, the red (oscillating) curve includes the time gating of the crystal. Due to the finite
length of the crystal, the spectrum actually generated corresponds to the red curve. These two
curves should be superimposed for proper operation. The Time (a.u. vs fs) graph shows the
simulated optical impulse time response of the filter vs fs (Re(h(t)) defined in section 2.1.3).
This allows to verify if the signal is entirely in the time gate (delimited by the purple rectangle).
If there is no clipping of the acoustic wave, the black and red curves are superposed.
4
this is possible because the trigger is periodic with excellent stability
V3.00 - 8
th
April 2019 (ContentsTable) (FiguresTable) 25/94