9 Measurement
FLUXUS H721 9.6 Display of measured values
125
UMFLUXUS_H721V1-5EN, 2022-05-15
Status line
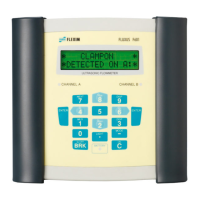
Important information of the running measurement is summarized in the status line. The quality and precision of the
measurement can be evaluated. Press during the measurement to scroll to the status line.
Fig. 9.6: Display of the status line
1 – status line
Tab. 9.9: Description of the status line
value explanation
S signal amplitude
0
…
9
< 5 %
…
≥ 90 %
values ≥ 3 are sufficient for the measurement
Q signal quality
0
…
9
< 5 %
…
≥ 90 %
c sound speed
comparison of the measured and the expected sound speed of the fluid
The expected sound speed is calculated from the fluid parameters.The expected sound speed is calculated from
the fluid parameters.
√ OK, is equal to the expected value
↑ > 20 % of the expected value
↓ < 20 % of the expected value
? unknown, cannot be measured
flow profile
information about the flow profile based on the Reynolds number
T fully turbulent flow profile
L fully laminar flow profile
↕ transition range between laminar and turbulent flow
? unknown, cannot be calculated
F flow velocity
comparison of the measured flow velocity with the flow limits of the system
√ OK, the flow velocity is not within the critical range
↑ the flow velocity is higher than the current limit
↓ the flow velocity is lower than the current cut-off flow
0 the flow velocity is within the limit range of the measuring method
? unknown, cannot be measured