104
Edge
®
820
EN
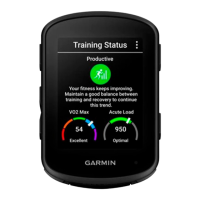
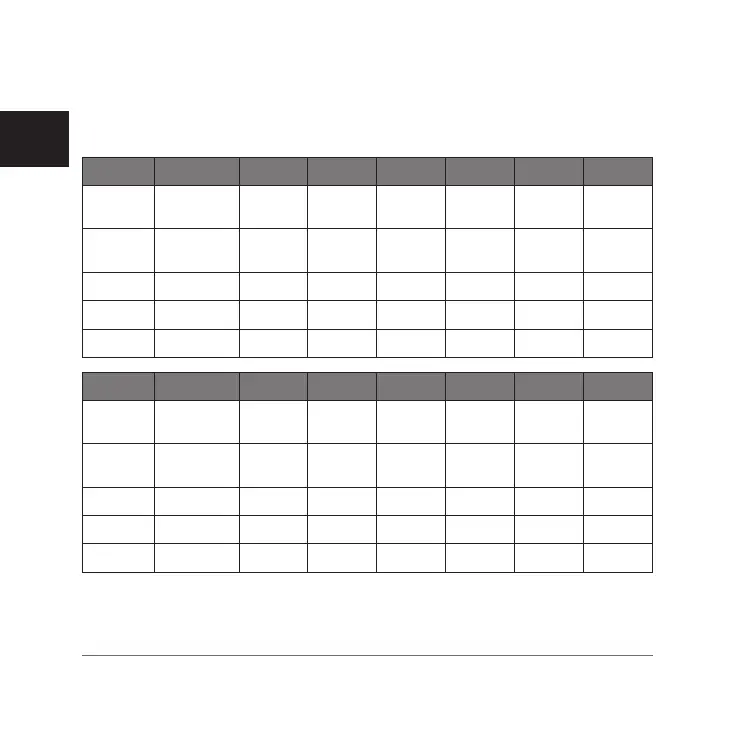
VO2 Max. Standard Ratings
These tables include standardized classifications for VO2 max. estimates by
age and gender.
Males Percentile 20–29 30–39 40–49 50–59 60–69 70–79
Supe-
rior
95 55.4 54 52.5 48.9 45.7 42.1
Excel-
lent
80 51.1 48.3 46.4 43.4 39.5 36.7
Good 60 45.4 44 42.4 39.2 35.5 32.3
Fair 40 41.7 40.5 38.5 35.6 32.3 29.4
Poor 0–40 <41.7 <40.5 <38.5 <35.6 <32.3 <29.4
Females Percentile 20–29 30–39 40–49 50–59 60–69 70–79
Supe-
rior
95 49.6 47.4 45.3 41.1 37.8 36.7
Excel-
lent
80 43.9 42.4 39.7 36.7 33 30.9
Good 60 39.5 37.8 36.3 33 30 28.1
Fair 40 36.1 34.4 33 30.1 27.5 25.9
Poor 0–40 <36.1 <34.4 <33 <30.1 <27.5 <25.9
Data reprinted with permission from The Cooper Institute. For more informa-
tion, go to www.CooperInstitute.org.
Edge 820_SEA英泰印 [4.75x4.75]-7.indd 104 2016/8/27 下午 03:01:36
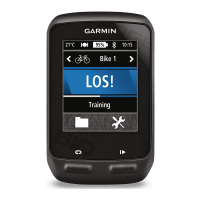
 Loading...