17-
18
750/760 Feeder Management Relay GE Power Management
17.6 METERING 17 COMMISSIONING
17
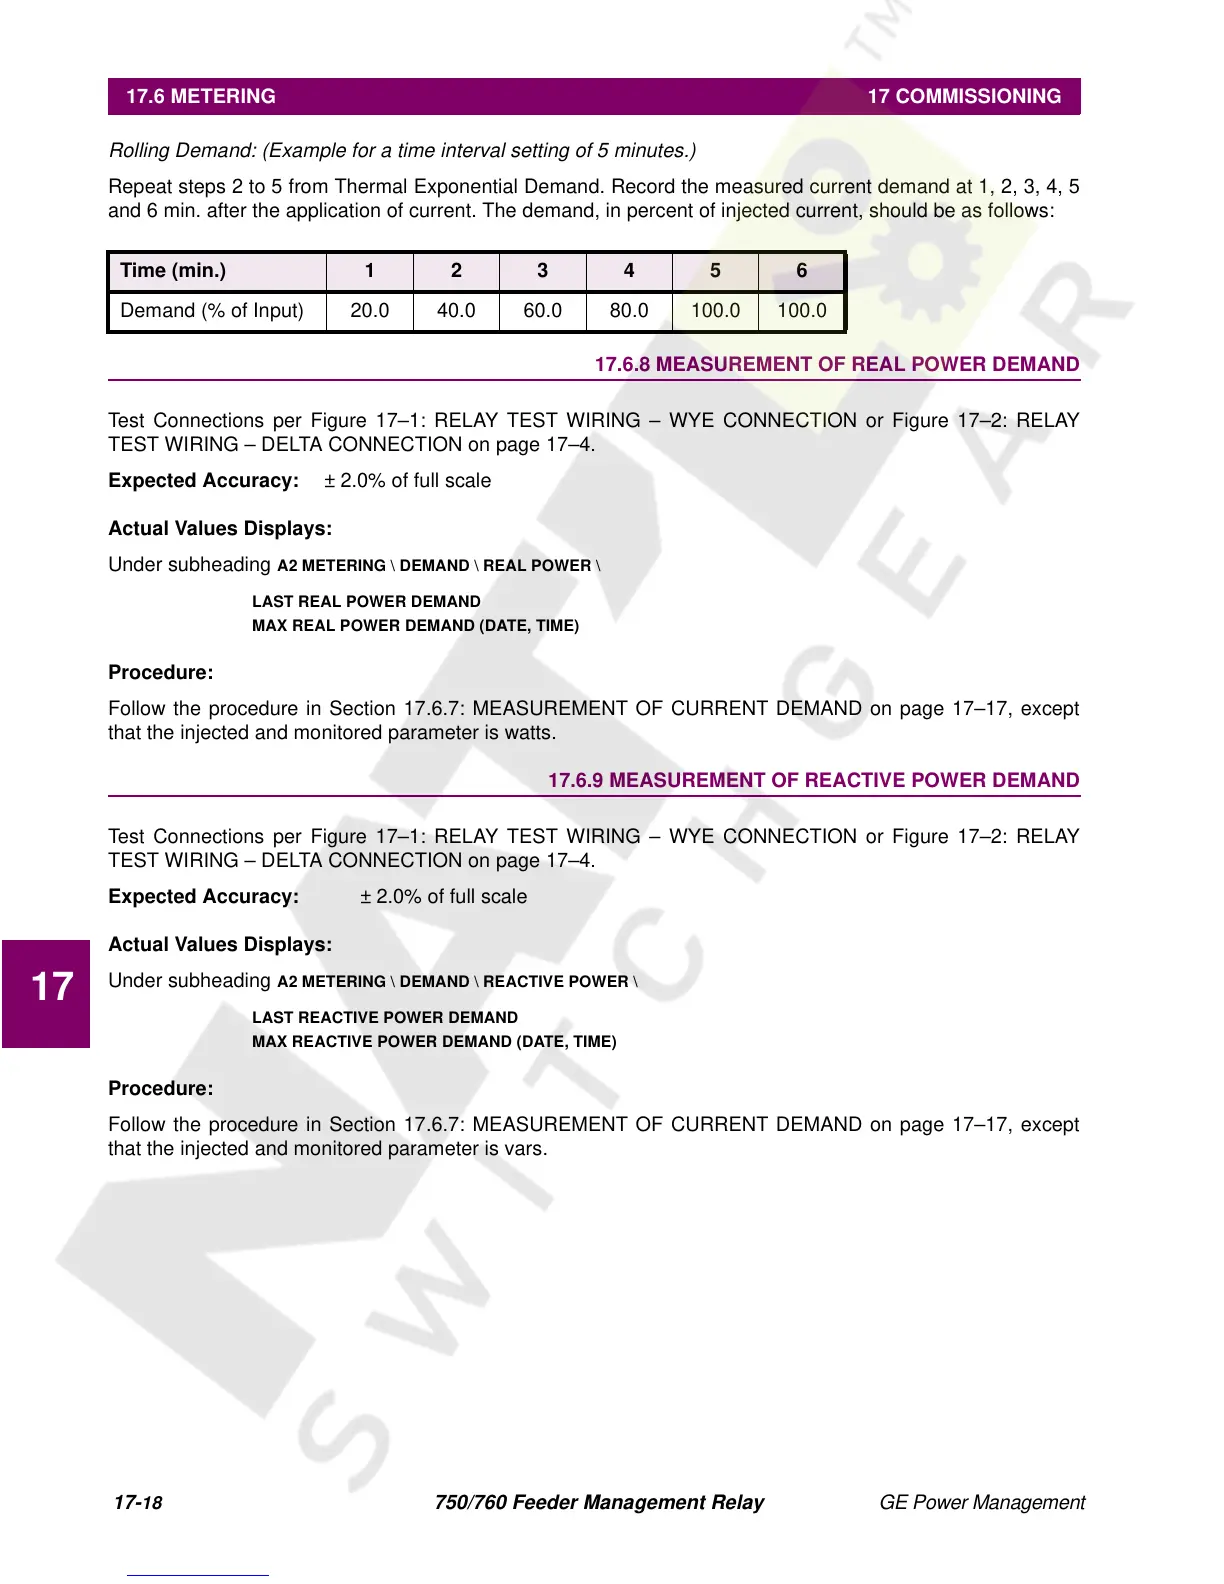
Rolling Demand: (Example for a time interval setting of 5 minutes.)
Repeat steps 2 to 5 from Thermal Exponential Demand. Record the measured current demand at 1, 2, 3, 4, 5
and 6 min. after the application of current. The demand, in percent of injected current, should be as follows:
17.6.8 MEASUREMENT OF REAL POWER DEMAND
Test Connections per Figure 17–1: RELAY TEST WIRING – WYE CONNECTION or Figure 17–2: RELAY
TEST WIRING – DELTA CONNECTION on page 17–4.
Expected Accuracy:
± 2.0% of full scale
Actual Values Displays:
Under subheading
A2 METERING \ DEMAND \ REAL POWER \
LAST REAL POWER DEMAND
MAX REAL POWER DEMAND (DATE, TIME)
Procedure:
Follow the procedure in Section 17.6.7: MEASUREMENT OF CURRENT DEMAND on page 17–17, except
that the injected and monitored parameter is watts.
17.6.9 MEASUREMENT OF REACTIVE POWER DEMAND
Test Connections per Figure 17–1: RELAY TEST WIRING – WYE CONNECTION or Figure 17–2: RELAY
TEST WIRING – DELTA CONNECTION on page 17–4.
Expected Accuracy:
± 2.0% of full scale
Actual Values Displays:
Under subheading
A2 METERING \ DEMAND \ REACTIVE POWER \
LAST REACTIVE POWER DEMAND
MAX REACTIVE POWER DEMAND (DATE, TIME)
Procedure:
Follow the procedure in Section 17.6.7: MEASUREMENT OF CURRENT DEMAND on page 17–17, except
that the injected and monitored parameter is vars.
Time (min.) 1 2 3 4 5 6
Demand (% of Input) 20.0 40.0 60.0 80.0 100.0 100.0
 Loading...