GD-Link V2 Adapter User Guide
26
CONFIG.TXT file, it indicates a successful file programming. If a FAIL.TXT file appears in the
disk, it indicates a programming failure. Double-click to open FAIL.TXT and check the reason
for the programming failure.
Note:
1. When the debugger loses power and is unplugged and reconnected, the previous
programming parameters will revert to default values.
2. The binary xxx.bin file should be generated by the compiler and the corresponding
download target address should be filled correctly, otherwise, programming failure may occur.
3.3. Debug function
3.3.1. SWD /JTAG debugging
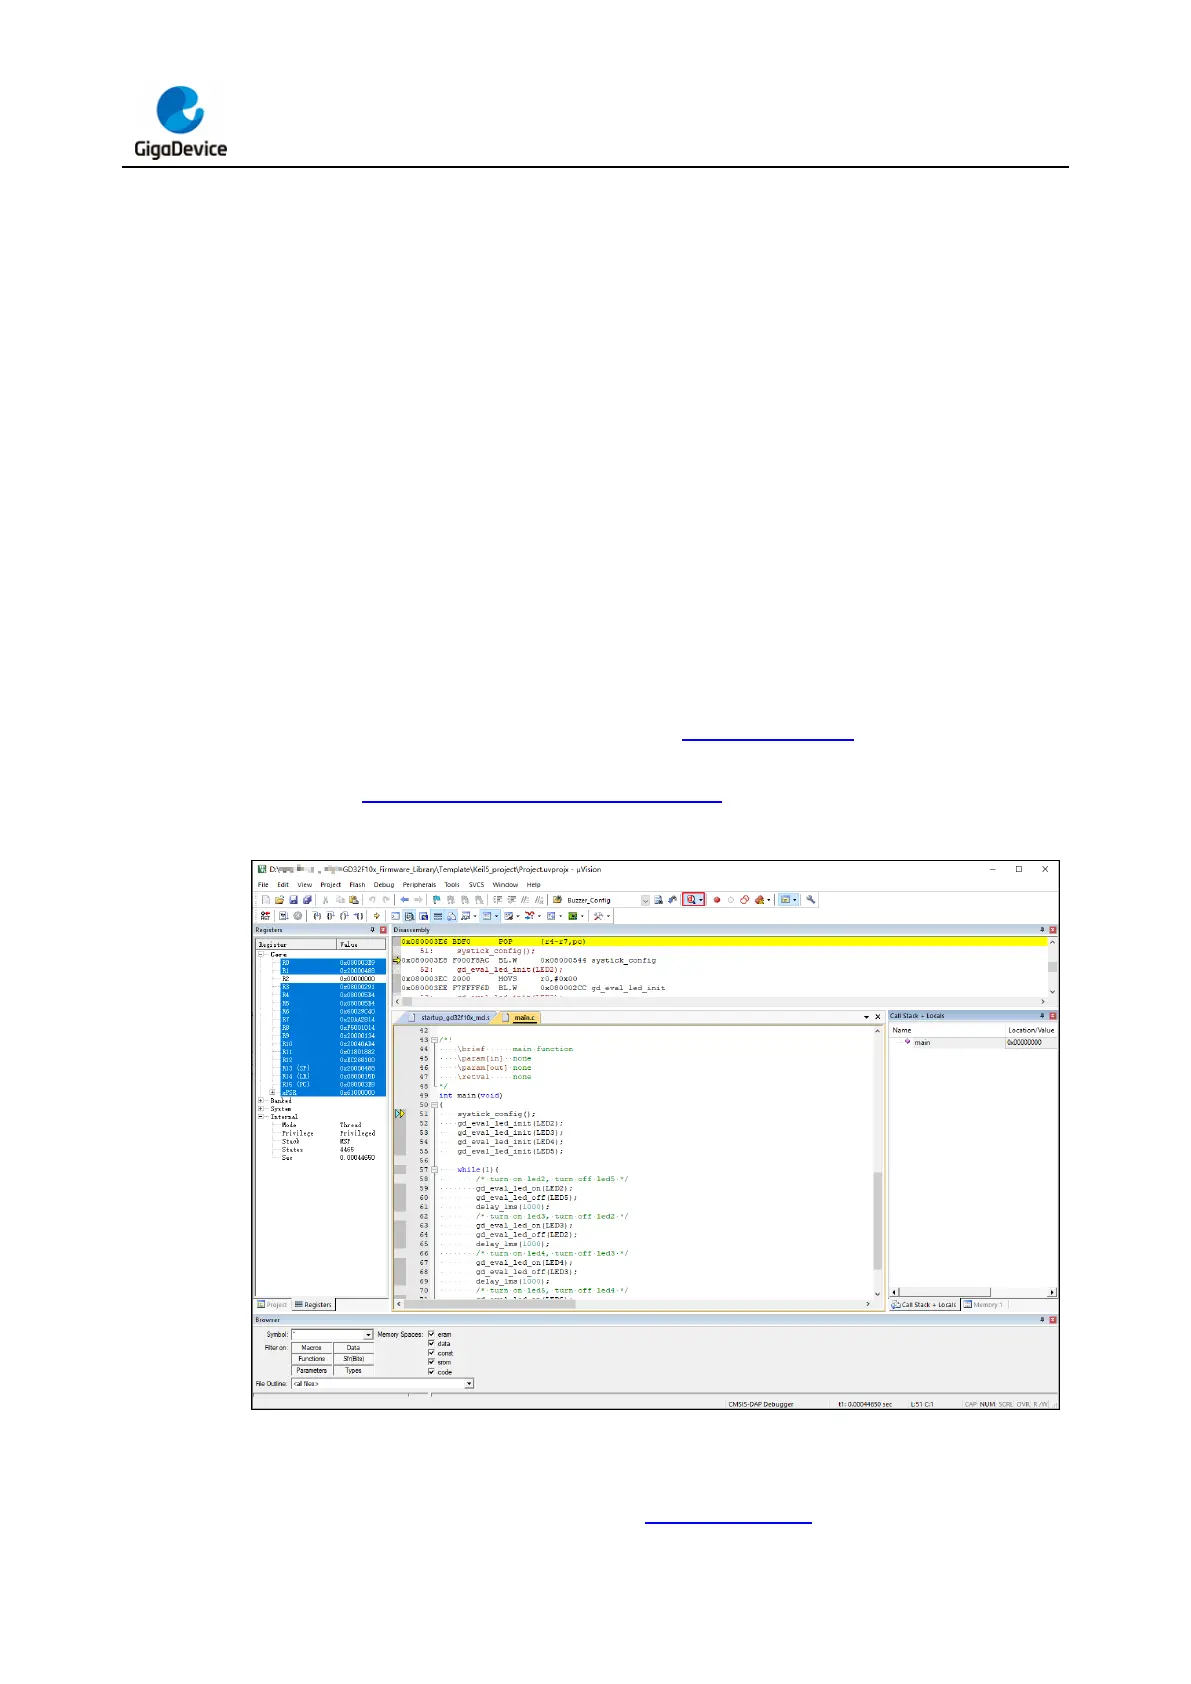
Debugging with KEIL (version 5.27 and above):
Complete the KEIL configuration according to IDE programming chapter, click the icon
button of "Start/Stop Debug Session" in the KEIL menu bar to enter the debugging interface,
as shown in Figure 3-27. KEIL debugging interface.
Figure 3-27. KEIL debugging interface
Debugging with IAR (version 8.50 and above):
Complete the IAR configuration according to IDE programming chapter, click the icon button