17
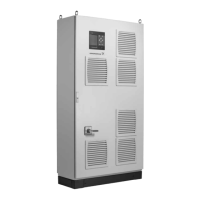
11.4.6 Measured values (1.2.4)
Fig. 12 Measured values
Description
This display gives a general status of all measured and calculated
parameters.
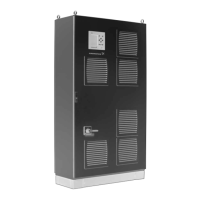
11.4.7 Analog inputs (1.2.5)
Fig. 13 Analog inputs
Description
The display shows an overview of the analog inputs and the
current measured values of each input. See sections
11.7.28 Analog inputs (4.3.8), 11.7.29 Analog inputs (4.3.8.1 to
4.3.8.7) and 11.7.30 Analog inputs and measured value (4.3.8.1.1
to 4.3.8.7.1).
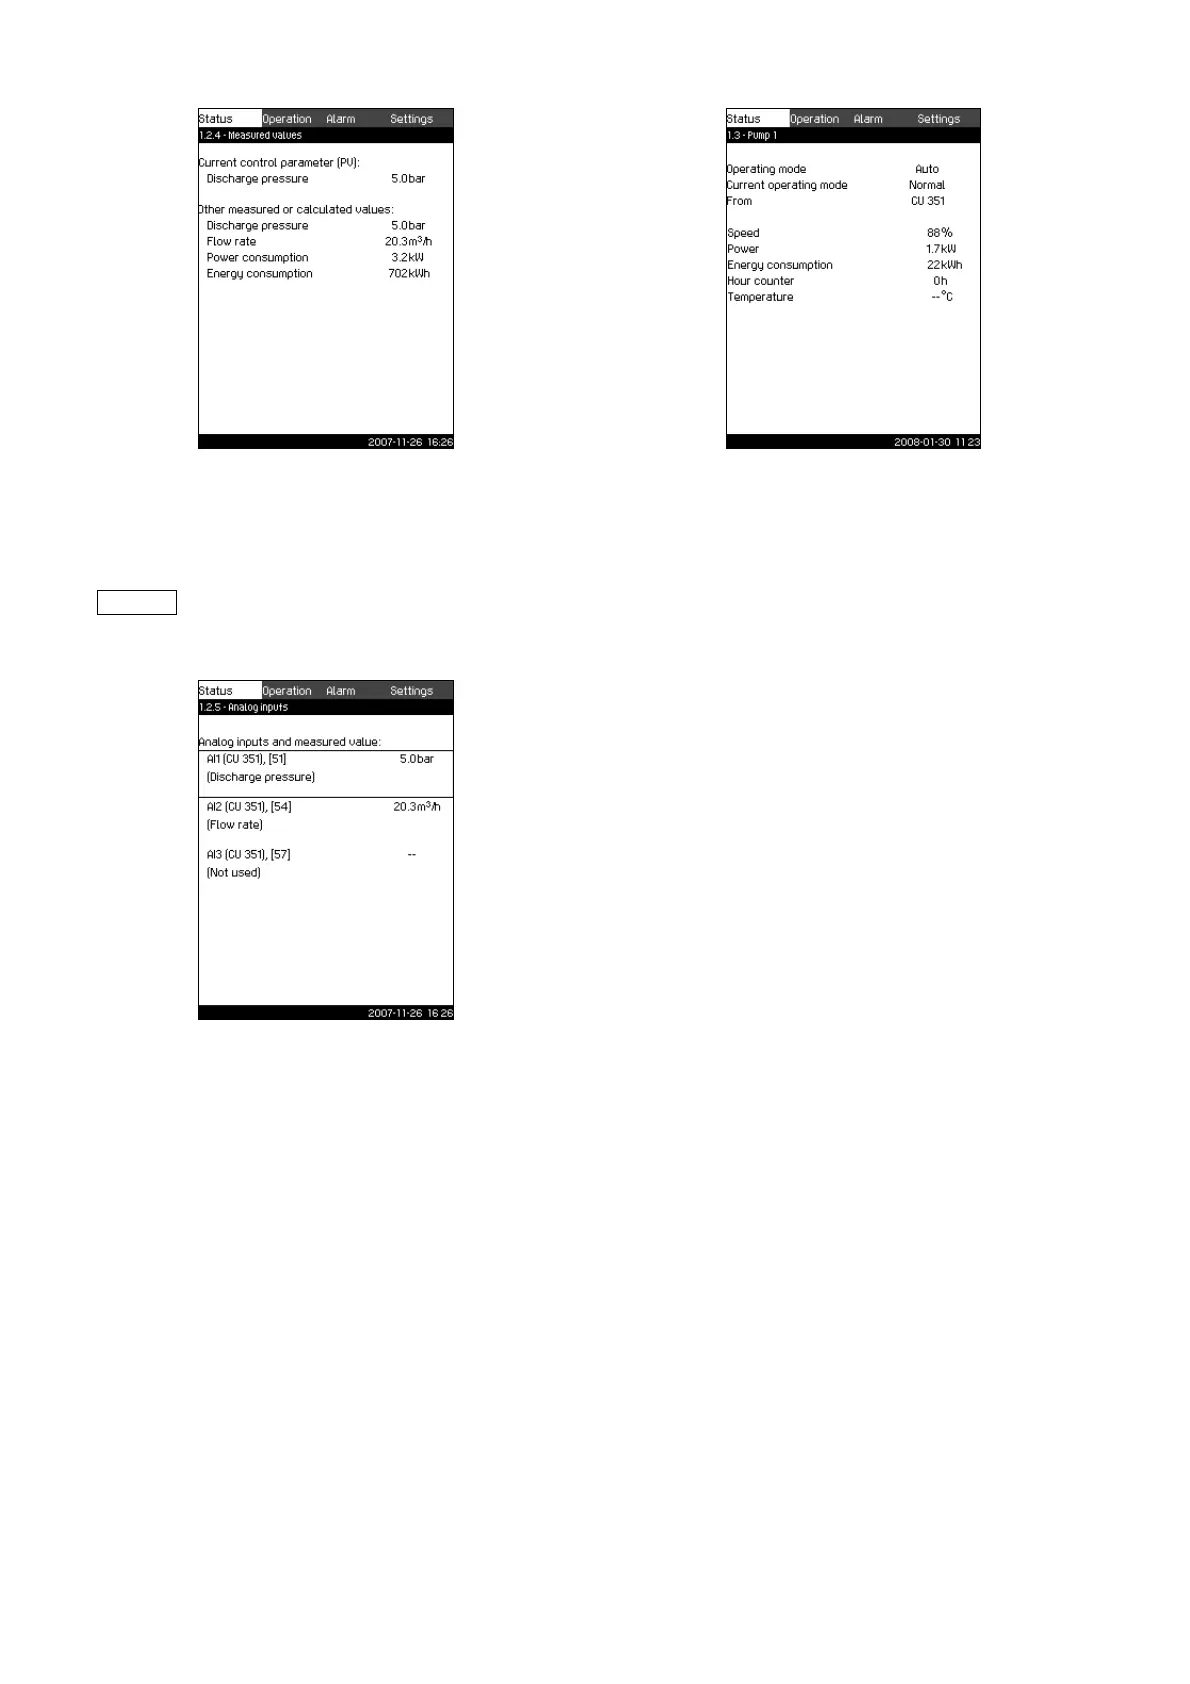
11.4.8 Pump 1...6 (1.3 to 1.8)
Fig. 14 Pump 1
Description
This display shows the operational state of the individual pumps.
The pumps may have different operating modes:
• Auto
Together with the other pumps in automatic operation, the
pump is controlled by the PI controller which ensures that the
system delivers the required performance.
• Manual
The pump is not controlled by the PI controller. In manual
operation, the pump has one of the following operating modes:
– Max.
The pump runs at a set maximum speed. (This operating
mode can only be selected for variable-speed pumps.)
– Normal
The pump runs at a set speed.
– Min.
The pump runs at a set minimum speed. (This operating
mode can only be selected for variable-speed pumps.)
– Stop
The pump has been forced to stop.
Besides information about the operating mode, it is possible to
read various parameters in the status display, such as these:
• current operating mode
• control source
• speed (only 0 or 100 % are shown for mains-operated pumps)
• power (only Control MPC-E)
• energy consumption (only Control MPC-E)
• operating hours.
TM03 2270 4807
The lines "Power consumption" and "Energy
consumption" are only shown in Control MPC-E
systems.
TM03 8949 4807
TM03 2268 4807