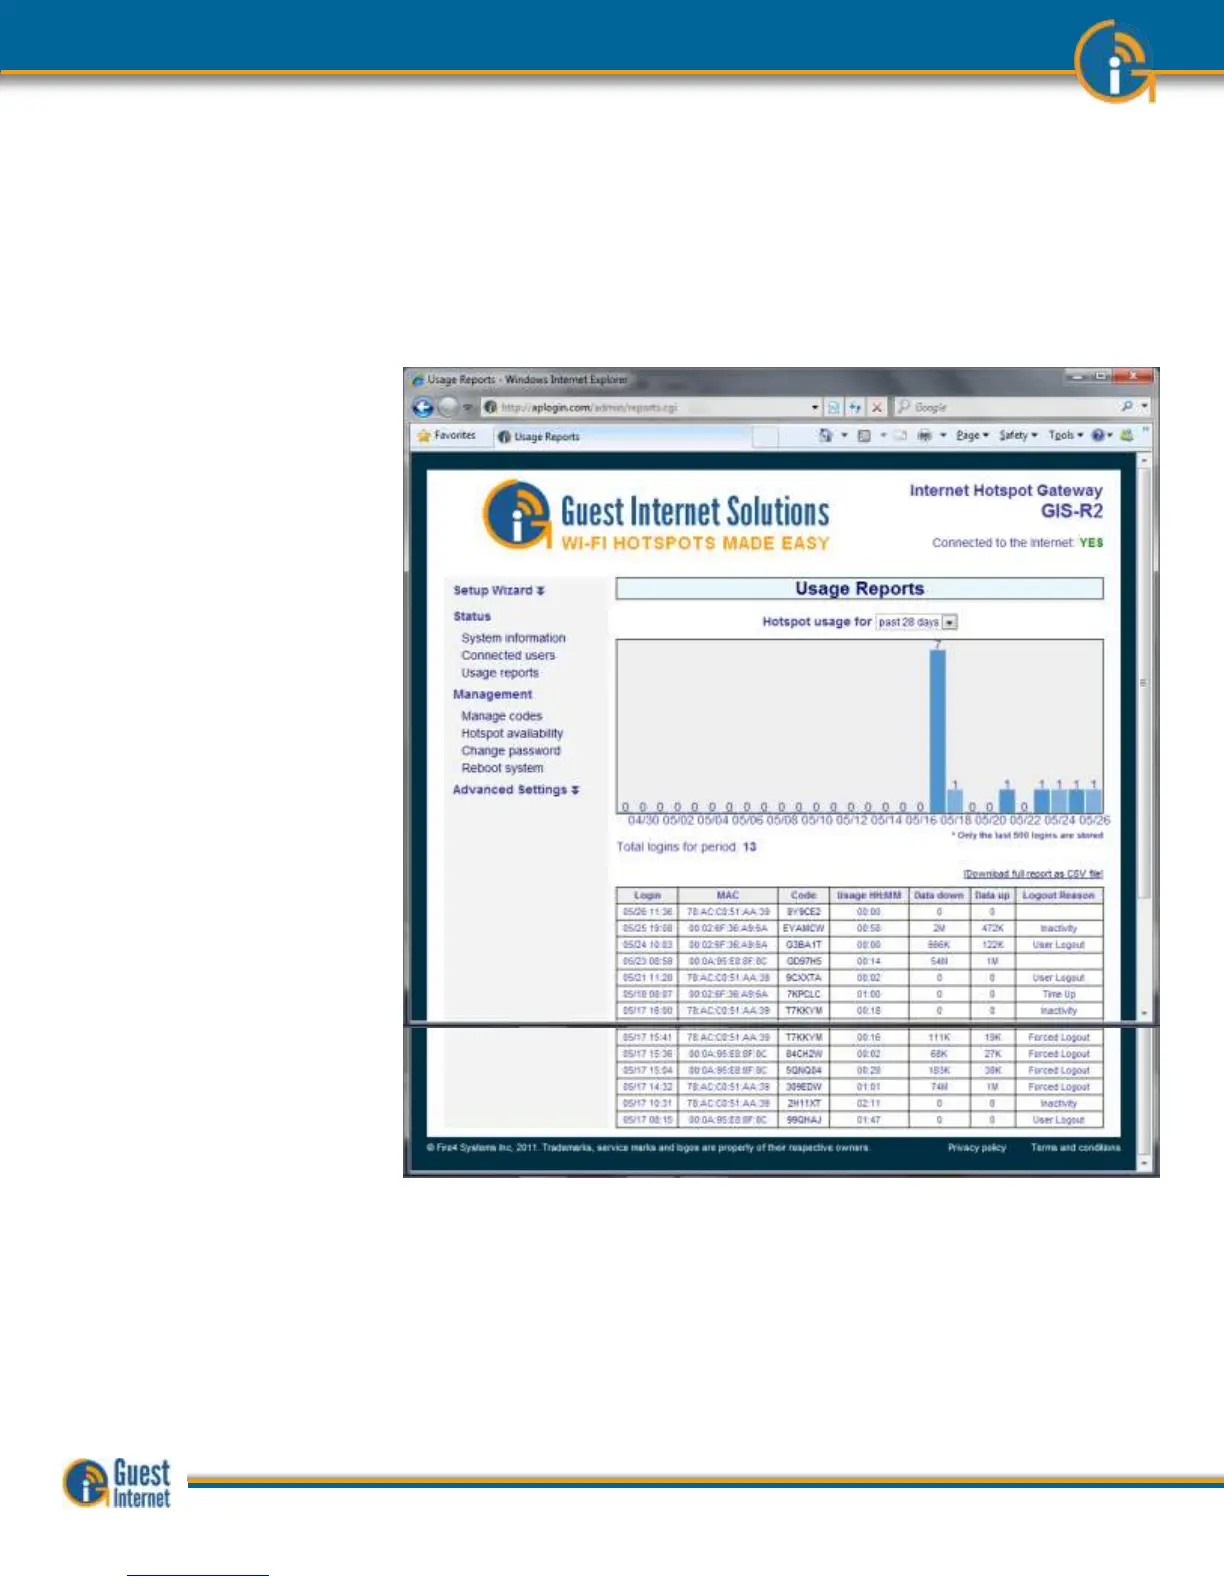
Clicking on Usage reports will display the page shown below. The last 1000 entries are
stored and displayed on this page. The number of users per day is shown on a time-
varying graph that can extend up to 28 days.
The usage data can be downloaded in a CSV format and loaded into a spreadsheet
program such as Excel for further analysis. The data table had seven parameters for each
entry: Login time, MAC address, Access code used, Time connected, Downloaded data
volume, Uploaded data volume, Logout reason.
 Loading...