ES User’s Guide 4-81
Using Instrument Functions
Printing and Plotting Measurement Results
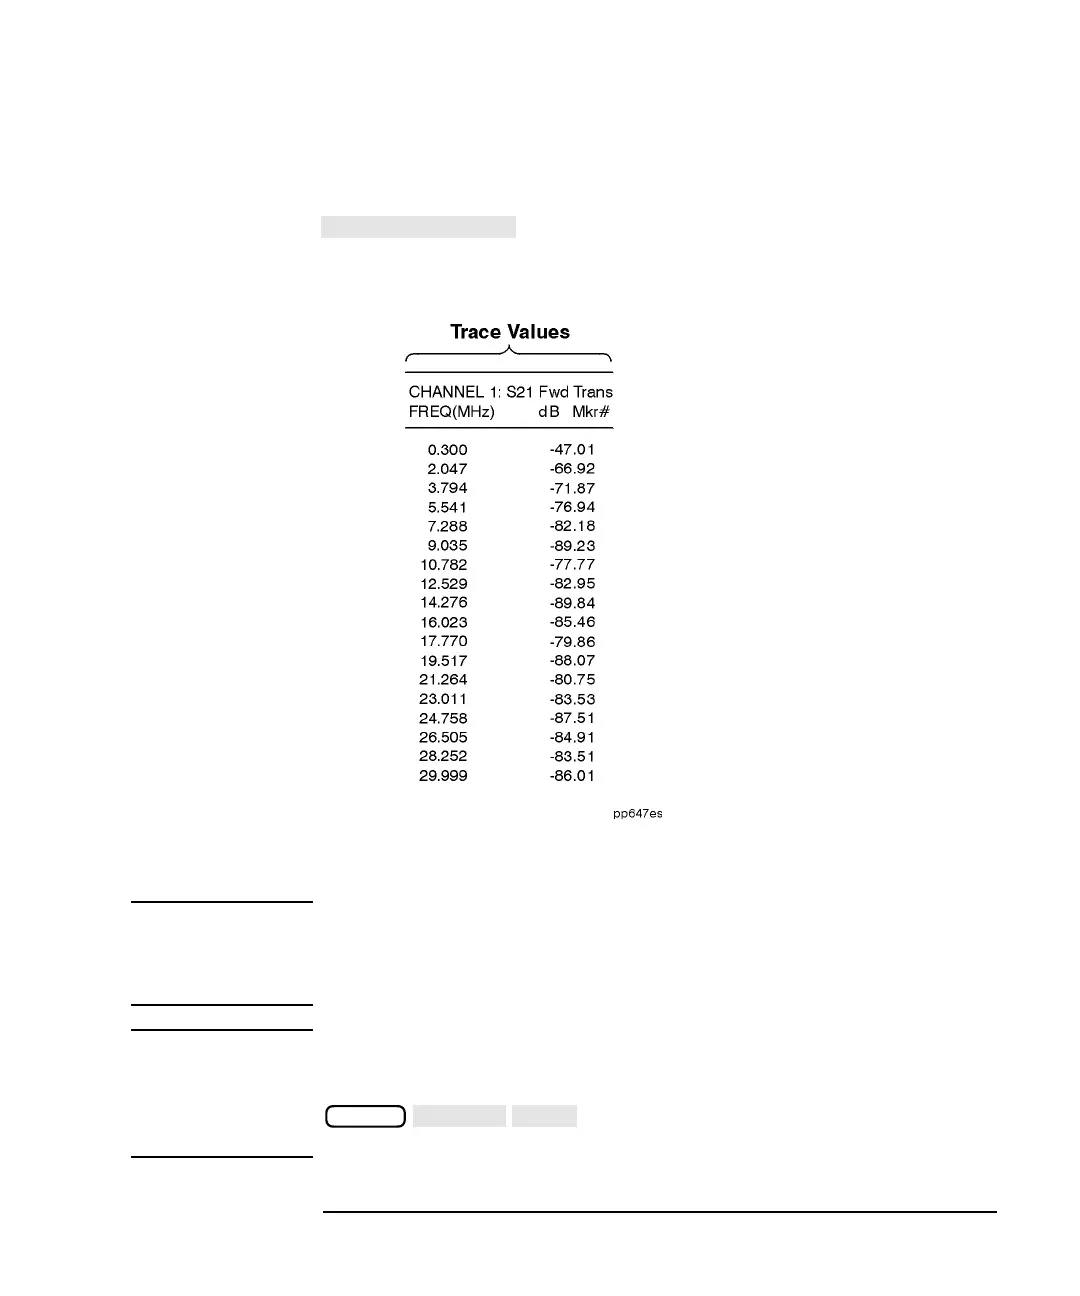
Figure 4-28 Trace Values
NOTE Figure 4-28 shows the trace values for a transmission measurement in
log mag format. Trace values for polar format will be frequency,
magnitude, and phase; while trace values for Smith chart format will be
frequency, resistance, and complex impedance.
NOTE You may notice a decrease in measurement speed when the network
analyzer is outputting to a printer or plotter that doesn't have a built-in
buffer. For the fastest possible hardcopy dump to such devices, press
before beginning the print or plot. Refer to
the following table for some typical print times.
outputs only the marker table. (This selection
allows printing of the limit-line table as well.)
MENU