E Clusters Passing Filter (%)—Shows the percentage of clusters passing filter. See
Clusters Passing Filter
on page 41.
F Estimated Yield (Gb)—Shows the number of bases projected for the run.
G Flow cell image—Shows the current process on each lane pair. One lane pair is imaging when the other
lane pair is in a chemistry step.
NOTE
After you select Home, it is not possible to return to view run metrics. However, run metrics are accessible on
BaseSpace or viewable from a standalone computer using the Sequencing Analysis Viewer (SAV).
Cycles for Run Metrics
Run metrics appear at different points in a run.
u During the cluster generation steps, no metrics appear.
u The first 5 cycles are reserved for template generation.
u Run metrics appear after cycle 25, including cluster density, clusters passing filter, yield, and quality
scores.
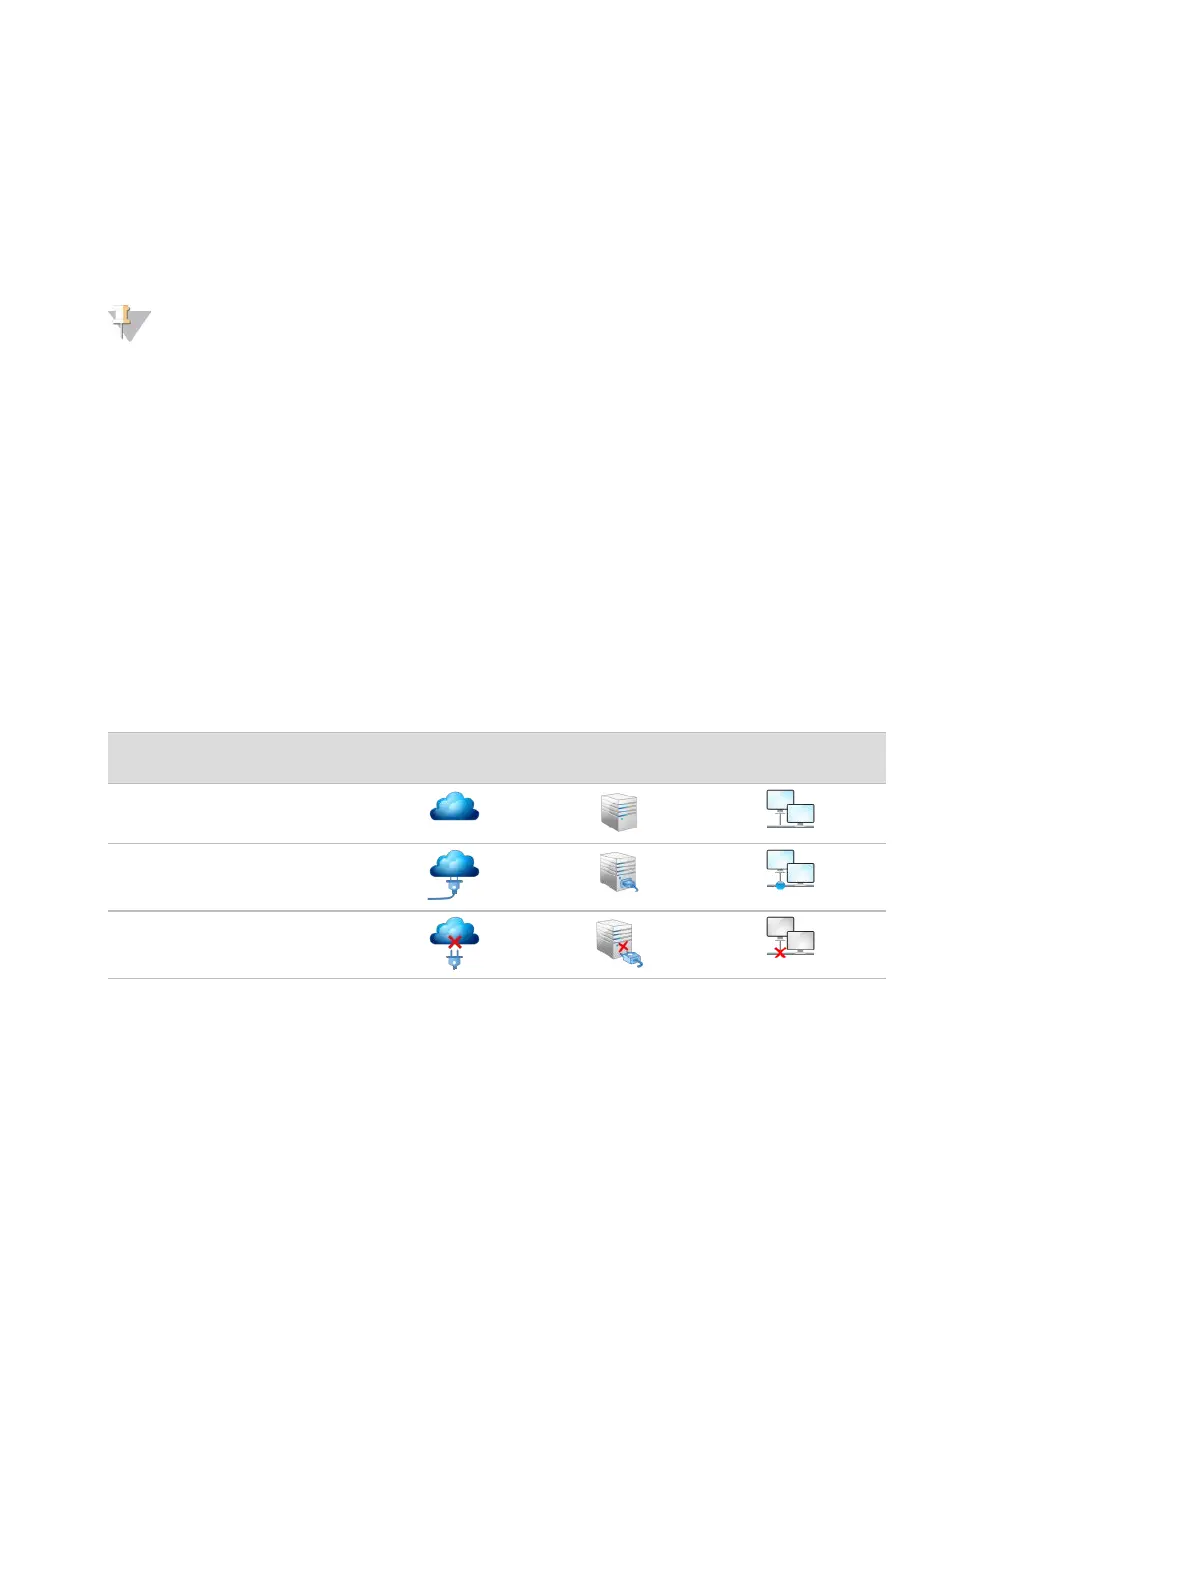
Data Transfer
Depending on the analysis configuration selected, an icon appears on the screen during the run to indicate
the data transfer status.
Status Illumina
BaseSpace
BaseSpace
Onsite
Standalone
Instrument
Connected
Connected and transferring
data
Disconnected
If data transfer is interrupted during the run, data are stored temporarily on the instrument computer. When
the connection is restored, data transfer resumes automatically. If the connection is not restored before the
run ends, manually remove data from the instrument computer before a subsequent run can begin.
Run Copy Service
The NextSeq System Software Suite includes a Run Copy Service. RTA v2 requests the service to copy files
from a source location to a destination location and the service processes copy requests in the order
received. If an exception occurs, the file is requeued for copy based on the number of files in the copy queue.
Sequencing Analysis Viewer
The Sequencing Analysis Viewer software shows sequencing metrics generated during the run. Metrics
appear in the form of plots, graphs, and tables based on data generated by RTA and written to InterOp files.
Metrics are updated as the run progresses. Select Refresh at any time during the run to view updated
metrics. For more information, see the
Sequencing Analysis Viewer User Guide (part # 15020619)
.
Document # 15046563 v04
For Research Use Only. Not for use in diagnostic procedures.
22
NextSeq 500 System Guide