8 Select Next.
Review Automated Check
The software performs an automated check of the system. During the check, the following indicators appear
on the screen:
u Gray checkmark —The check has not been performed yet.
u Progress icon—The check is in progress.
u Green checkmark—The check passed.
u Red X —The check did not pass. For any items that do not pass, an action is required before you can
proceed. See
Resolve Automatic Check Errors
on page 30.
To stop an automated check in progress, select the icon in the lower-right corner. To restart the check,
select the icon. The check resumes at the first incomplete or failed check.
To view the results of each individual check within a category, select the icon to expand the category.
Start the Run
When the automated check is complete, select Start. The sequencing run begins.
To configure the system to start the run automatically after a successful check, see
Set Run Setup Options
on page 9.
Monitor Run Progress
1 Monitor run progress, intensities, and quality scores as metrics appear on the screen.
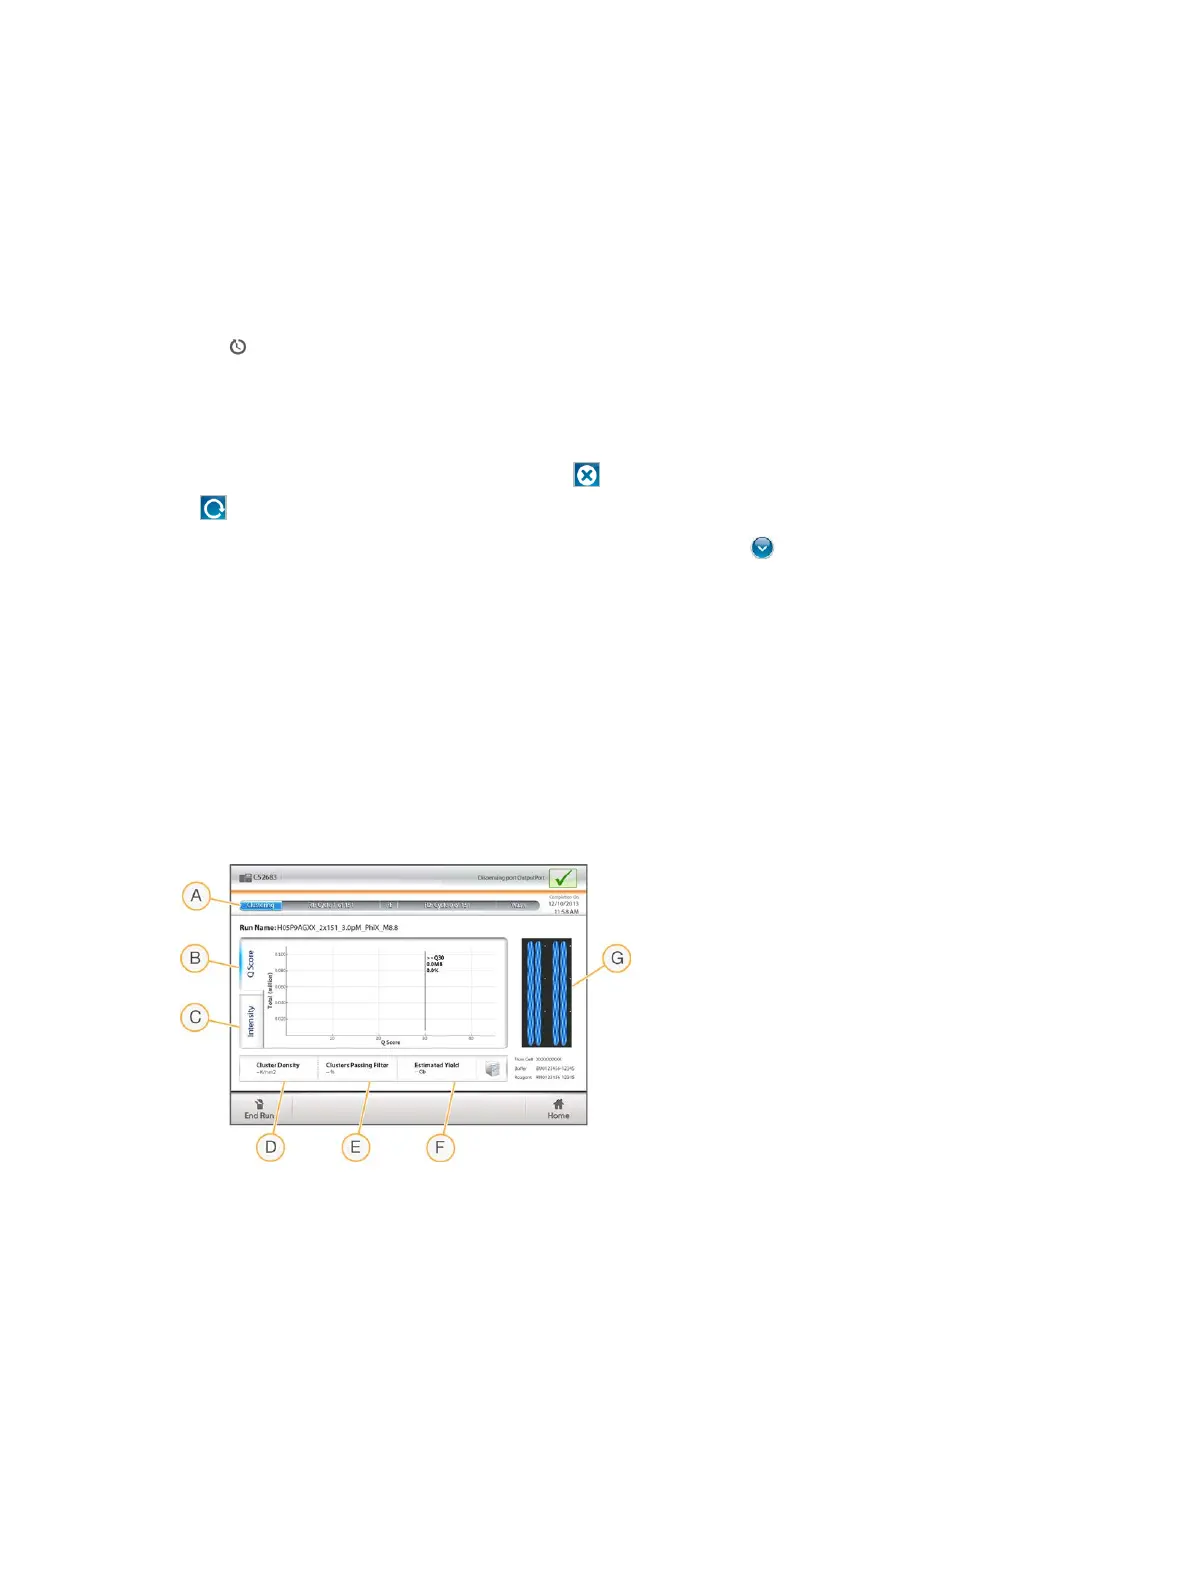
Figure 18 Sequencing Run Progress and Metrics
A Run progress—Shows the current step and number of cycles completed for each read. The progress
bar is not proportional to the run rate of each step. Use the time remaining in the upper-right corner to
determine actual duration.
B Q-Score—Shows the distribution of quality scores (Q-scores). See
Quality Scoring
on page 41.
C Intensity—Shows the value of cluster intensities of the 90
th
percentile for each tile. Plot colors indicate
each base: red is A, green is C, blue is G, and black is T. Colors match base indicators used in the
Sequencing Analysis Software (SAV).
D Cluster Density (K/mm²)—Shows the number of clusters detected for the run.
Document # 15046563 v04
For Research Use Only. Not for use in diagnostic procedures.
21
NextSeq 500 System Guide
 Loading...