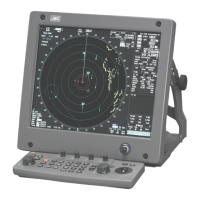
2-7 Section 2 Name and Function of Each Unit
1
2
3
4
5
6
7
8
9
10
11
12
13
14
15
16
17
18
19
20
21
22
23
24
25
APP A
APP B
2.2.1.1 Color-coded numeric display
The background of the value from each sensor is displayed in three colors.
Background color Status of numeric value
Normal color The numeric value is normal.
Yellow
The numeric value is displayed in yellow when it is unreliable such as when
the difference with the previous value is greater than the threshold value.
Orange
When the numeric value is abnormal, "****" is displayed in orange.
2.2.1.2 Color coding of bar graphs
Bar graphs are color-coded at display as follows.
Red: Port side/backward direction
Green: Starboard side/forward direction
2.2.1.3 Numeric box
A numeric value is displayed in the numeric box outside of the graph as required.
Example: Arc-like bar graph (rudder angle, etc.)
Memo
The graph and numeric value box are displayed separately from each other depending on the
Conning Display you use.
 Loading...