– 56 –
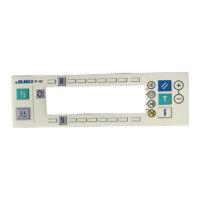
Switch/display Description
A Pitch time graph display A graph vertical axis of which represents the production volume and hori-
zontal axis of which represents the pitch time is displayed.
The ranges of the vertical and horizontal axes can be set on the pitch
time monitor screen No. 2.
B Cursor display The location of the cursor is displayed.
C Continuous section display The continuous section set on the graph is displayed.
The total production volume and average pitch time in a continuous sec-
tion selected on the pitch time monitor screen No.2 can be checked.
D Cursor pitch time display The pitch time in the section specied by the cursor on the graph is dis-
played.
E
Display of the production vol-
ume in a cursor section
The production volume in the section specified with the cursor on the
graph is displayed.
F Latest pitch time display The length of time between two times of thread trimming is measured
and displayed.
* If the pitch time is equal to or longer than 1800 seconds (30 minutes), it
will be regard as defective data and ---- will be displayed instead of the
pitch time.
1
Production volume count-up
switch
The production volume is counted up with one item added.
2
Function selector switch The cursor or the continuous section selection (beginning and end) is se-
lected.
3
Function shifting switch Selected function is shifted to the right or left.
4
Graph scroll switch When this switch is pressed shortly, the graph is scroll to the right or left
by one section.
When this switch is held pressed for a longer time, the graph is scrolled
to the right or left on a page-by-page basis.
5
Display changeover switch to
display the pitch time monitor
screen No. 2
The pitch time monitor screen No. 2 is displayed.
6
Production volume counter cor-
rection switch
The production volume can be corrected by increasing/decreasing the
number shown on the counter in increments of 1.
Explanation of displayed information and operating switches on the pitch time monitor screen No. 1
(pitch time graph mode)