– 57 –
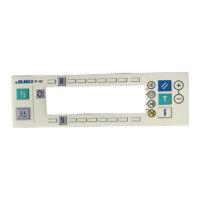
(3) Pitch time monitor screen No. 2
1
2
3
1
2
3
7
5 6
4
B
A
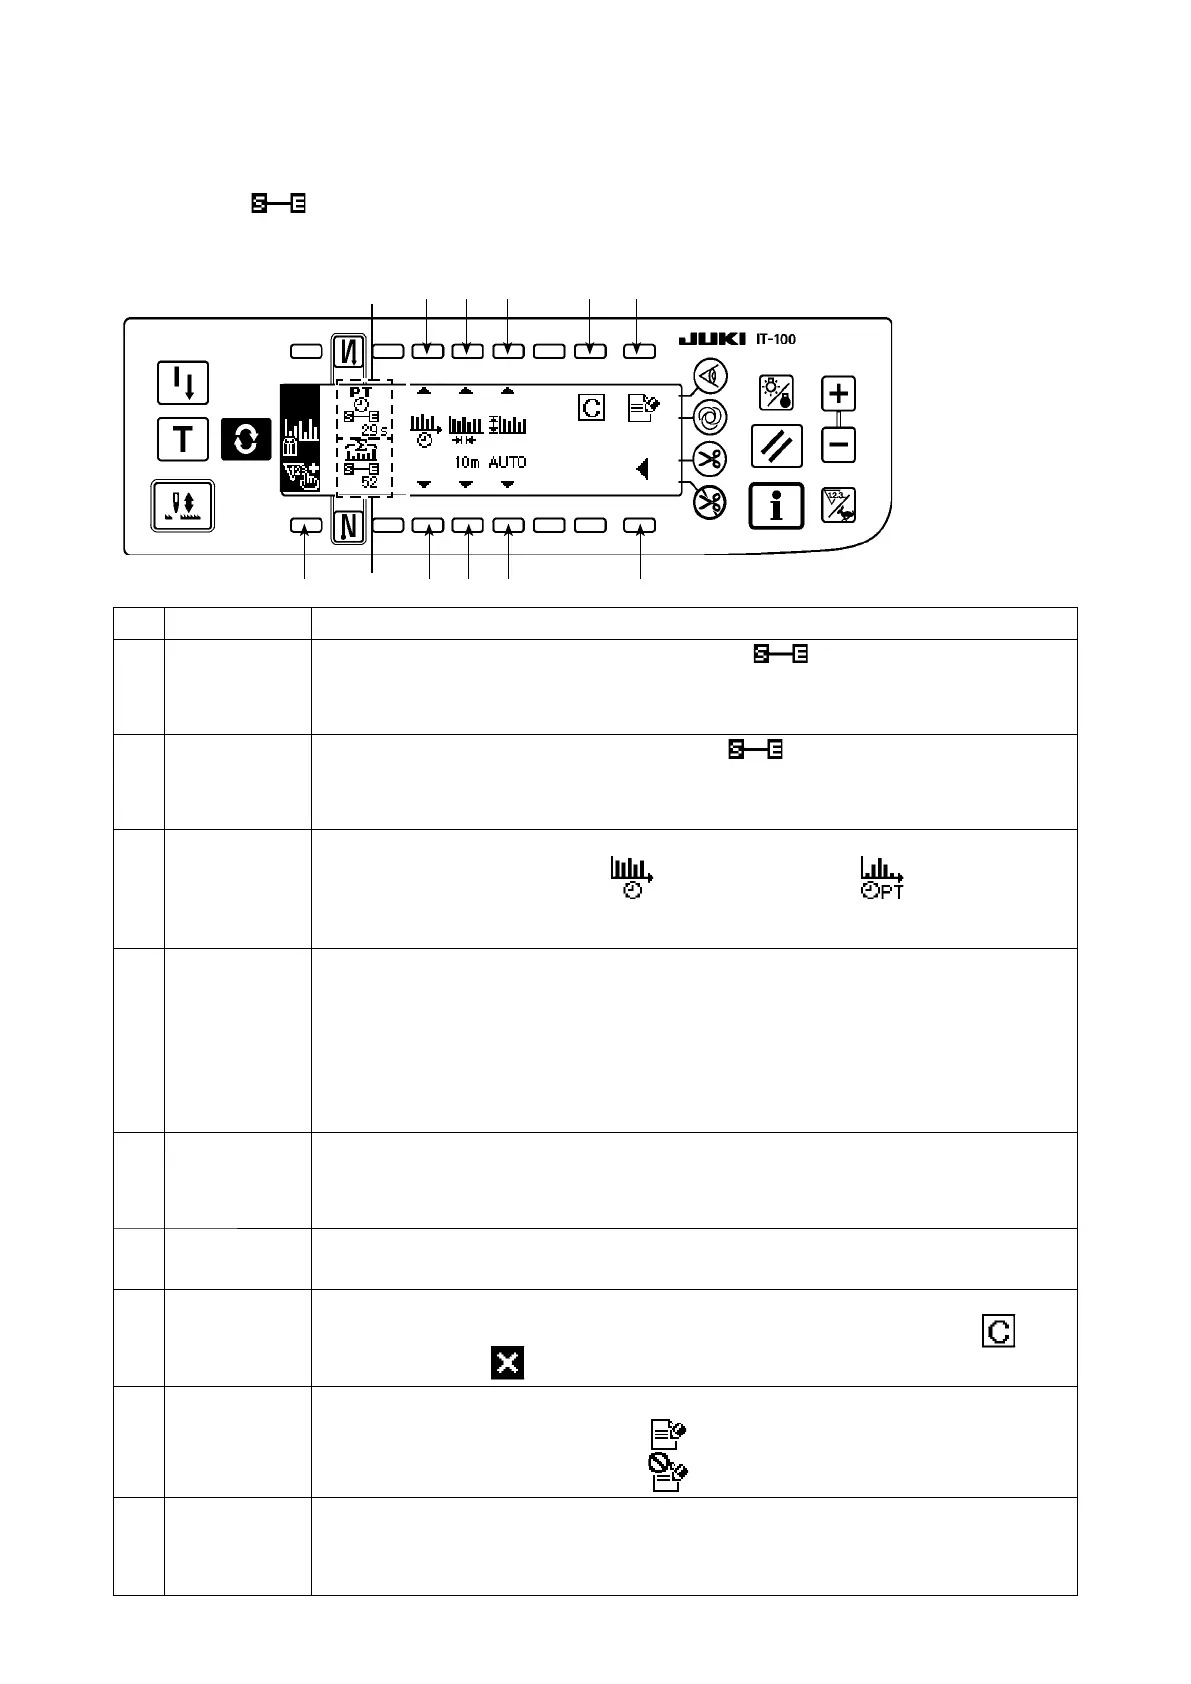
<Pitch time monitor screen No. 2>
On the pitch time monitor screen No. 2, the total production volume and the average pitch time in the con-
tinuous section selected on the pitch time monitor screen No. 1 are measured and displayed. (Sections
A and B in the gure given below) In addition, the display method employed on the pitch time monitor screen
No. 1 is specied.
Switch/display Description
A Total production
volume display
The total production volume in the continuous section selected on the pitch time moni-
tor screen No. 1 is displayed.
(Caution) The production volume is approximately 3200 at the maximum due to the restriction
by the pitch time monitor data capacity.
B A ve r a g e p i t c h
time display
The average pitch time in the continuous section selected on the pitch time monitor
screen No. 1 is displayed. It should be noted, however, that pitch time data equal to or longer
than 1800 seconds (30 minutes) is judged to be abnormal sewing work and is excluded from
calculation.
1
G r a p h m o d e
c h a n g e o v e r
switch
The mode of graph displayed on the pitch time monitor screen No. 1 is changed over.
Production volume graph mode :
Vertical axis : Production volume
Horizontal axis : Working time of day
Pitch time graph mode :
Vertical axis : Production volume
Horizontal axis : Pitch time
2
Graph's horizon-
t a l a x i s r a ng e
setting switch
The range of the horizontal axis (time unit in one section) of the graph displayed on the pitch
time monitor screen No. 1 is set.
・
Under the production volume graph mode :
Setting range : 10 m, 15 m, 20 m, 30 m, 1 h, 2 h, 4 h, 8 h, 12 h, 1 d Initial setting : 30 m
* "m" represents minute, "h" represents hour and "d" represents day.
・
Under the pitch time graph mode:
Setting range : 3 s, 5 s, 10 s, 15 s, 20 s, 30 s, 1 m Initial setting : 5 s
* "s" represents second and "m" represents minute.
3
Graph's vertical
r a n g e s e t t i n g
switch
The range of the vertical axis of the graph displayed on the pitch time monitor screen No. 1 is set.
Setting range: 10, 20, 50, 100, 200, 500, 1000, 2000, 3000, 5000, auto Initial setting : auto
* In the case of "auto," the range is automatically selected to display the production volume on
the vertical axis as large as possible at all times.
4
Production volume
count-up switch
The production volume is counted up with one item added.
5
Clear switch The pitch time monitor data recorded in the sewing machine memory are cleared.
* When this switch is pressed, the clear conrmation popup screen appears. Press switch
to clear the data, or switch to cancel clearing.
6
M e a s u r e m e n t
stop switch
Measurement and recording of sewing machine operation data are stopped.
When measurement is being carried out, is displayed.
When measurement is in the stop status, is displayed.
7
Display changeover
switch to display the
pitch time monitor
screen No. 1
The pitch time monitor screen No. 1 is displayed.