– 55 –
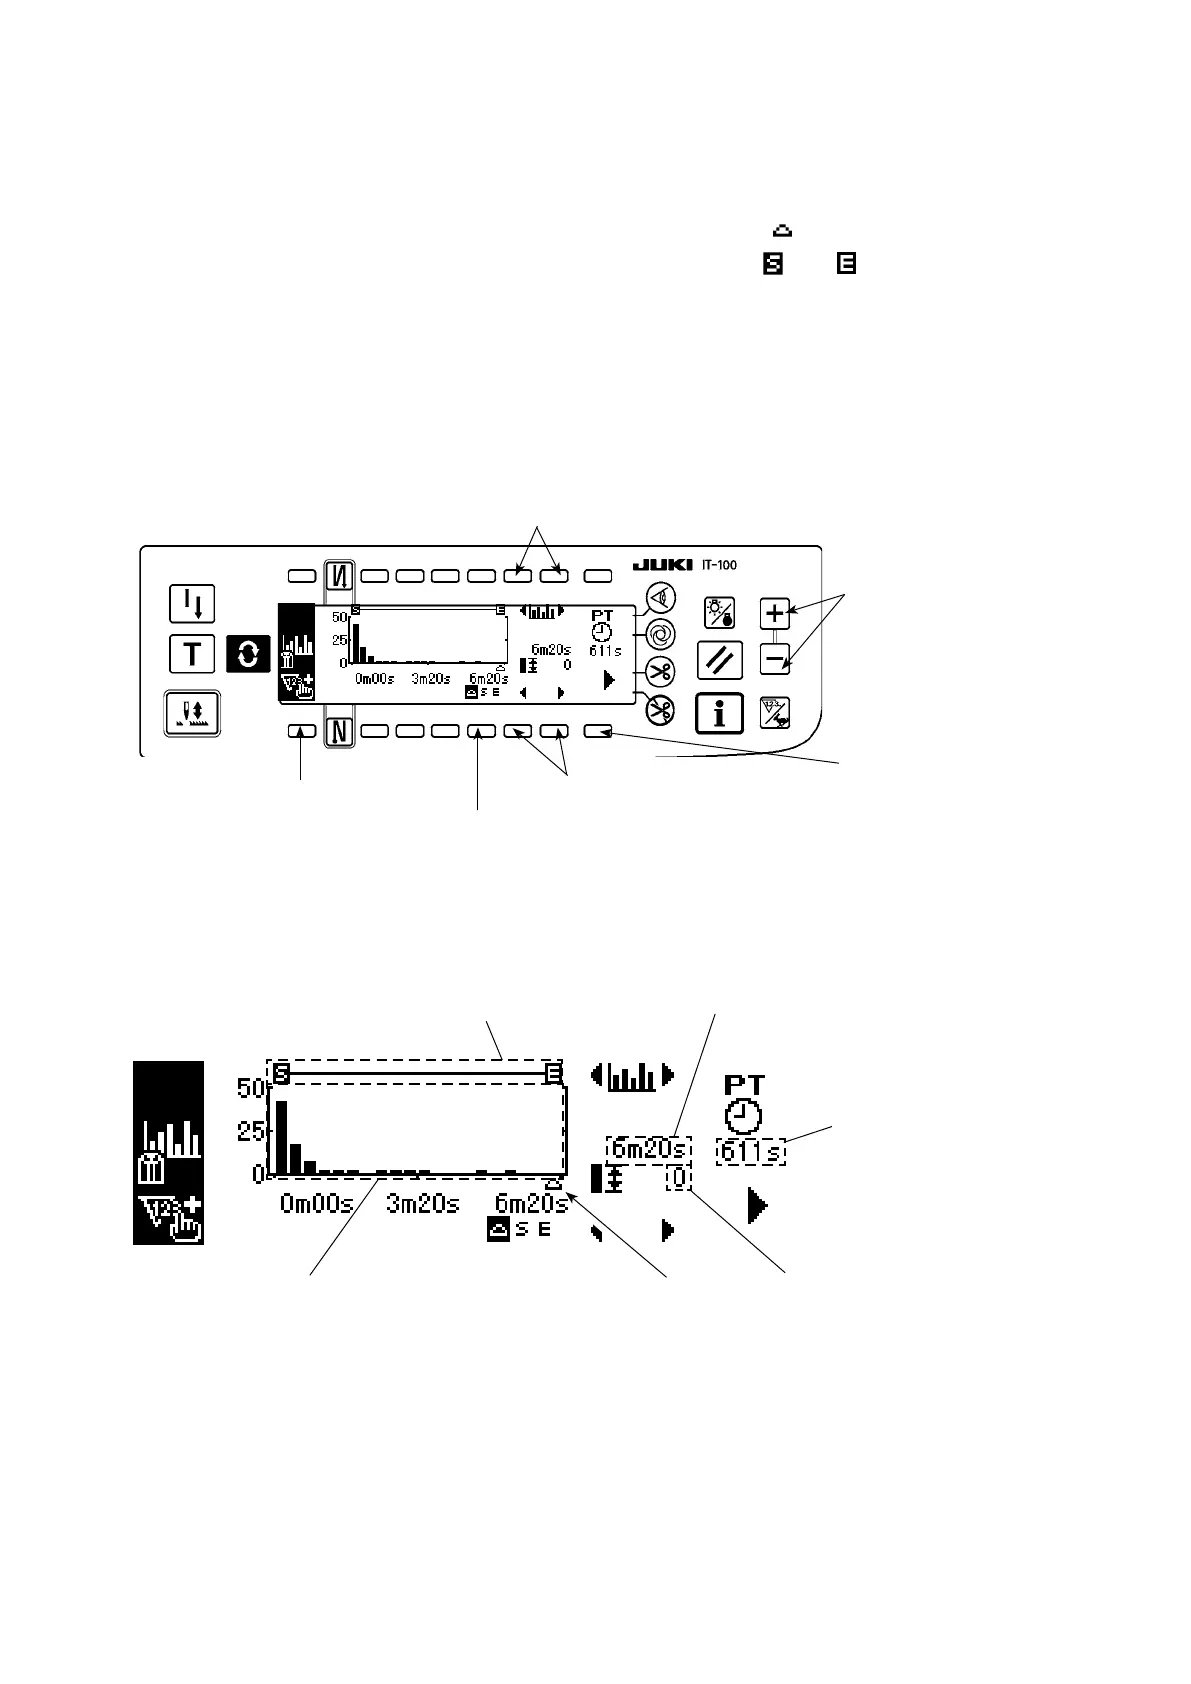
(2) Pitch time graph mode
A graph vertical axis of which represents the production volume and horizontal axis of which represents the
pitch time is displayed. On this graph, variation in the working time is visualized to enable checking whether
there is a problem work.
In addition, the production volume in the section specied with the cursor can be displayed, and the total
production volume and average pitch time in the section specied with and can be checked on the
pitch time monitor screen No. 2. In this way, detailed information on an arbitrary section can be checked.
* Refer to
"
#
. 5-1. How to change over the screen under the normal sewing mode"
for the operating
procedure to be taken until this screen is displayed.
<Pitch time monitor screen No. 1 (pitch time graph mode operating switch)>
<Pitch time monitor screen No.1>
Display
changeover
switch to display
the pitch time
monitor screen
No.2
5
Production volume count-up switch
1
Graph scroll switch
4
<Pitch time monitor screen No.1 (Pitch time graph mode displayed information)>
Production
volume counter
correction switch
6
Function shifting switch
3
C. Continuous section display
D. Cursor pitch time display
F. Latest pitch time display
E. Display of the production
volume in a cursor section
B. Cursor display
A. Pitch time graph display
Function selector switch
2