3 Operation and visualization
38
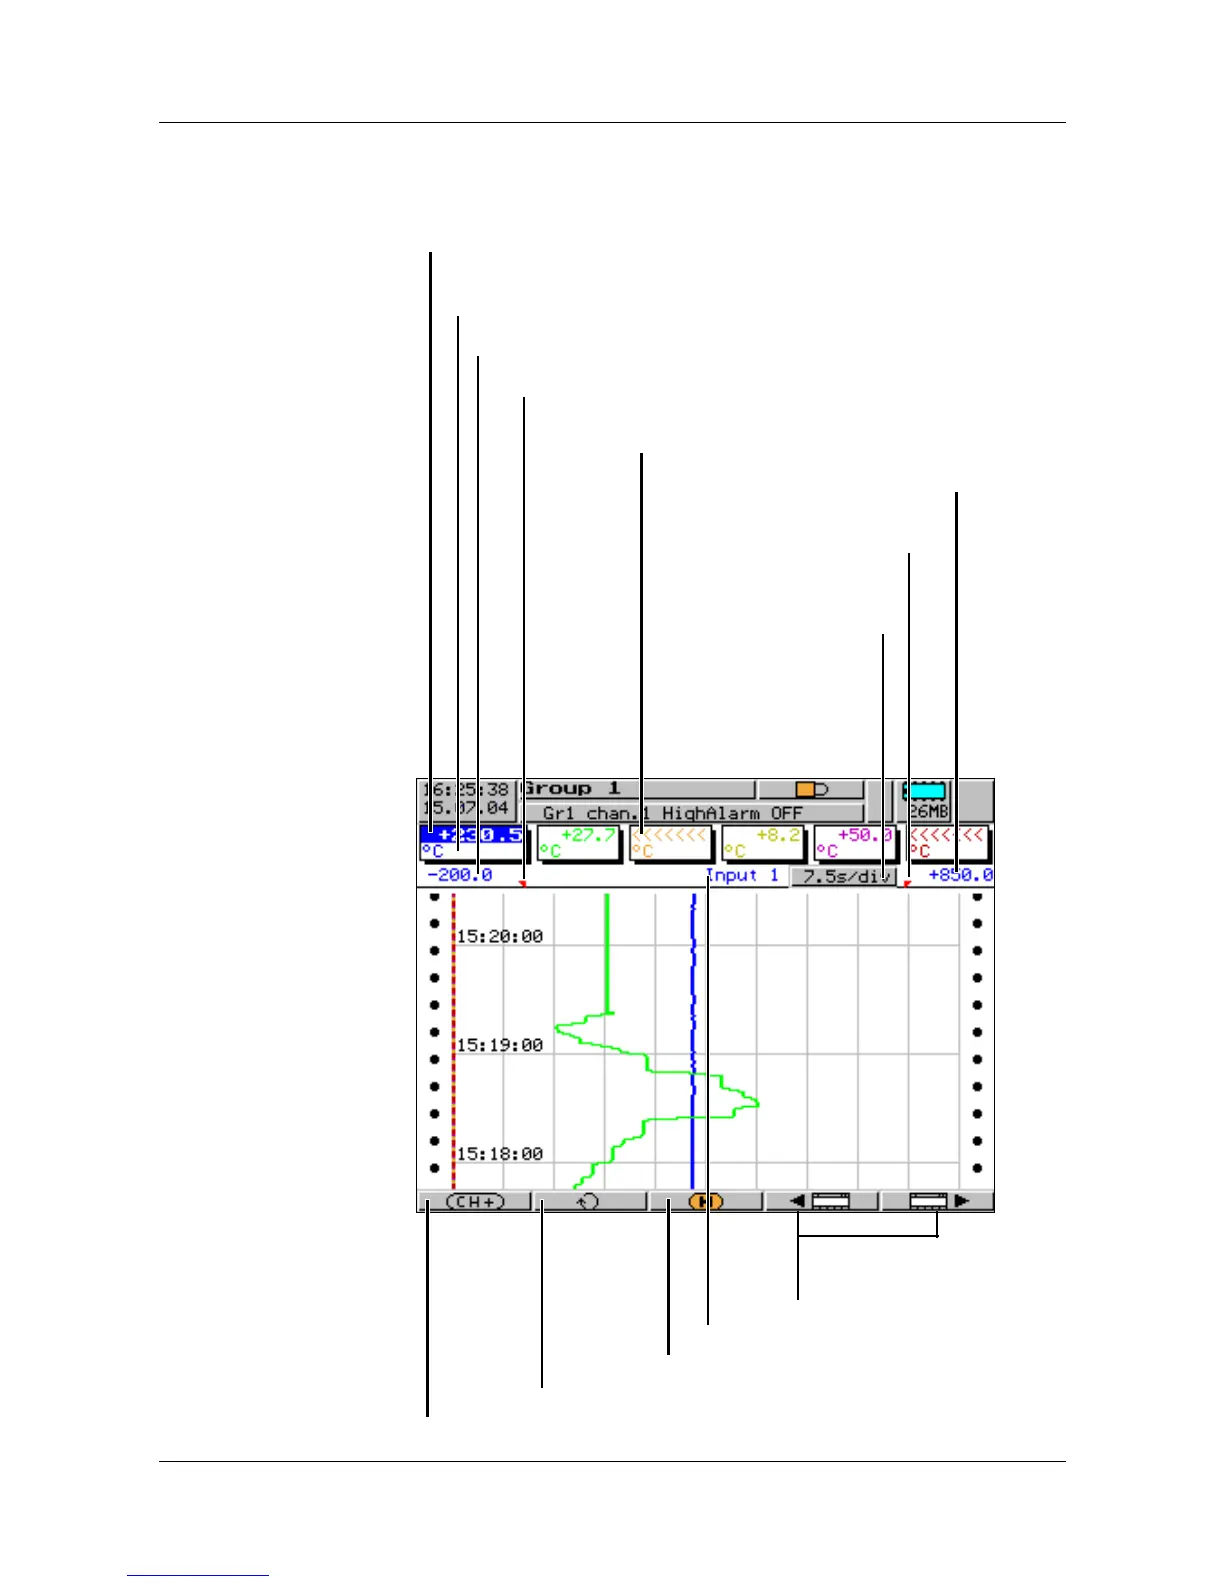
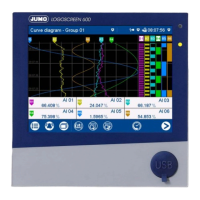
3.2.1 Vertical diagram
Vertical diagram representation can be accessed from the group manager
(v page 37), after a group has been selected:
- present measurements of the analog inputs of the group
- measurement on a red background ⇒ out of limit
Unit of measurement
Scaling start of the selected channel
Lower limit index of the selected channel
(no display when alarm is off)
Upper limit index
(no display when alarm
is off)
Scaling end
of the selected channel
Select next channel
Switch to the next active group
Change to the previous/
next visualization
Underrange on channel 3
Evaluation of the stored measurement data
Present diagram
speed
Background color:
gray = normal operation,
blue = timed operation,
orange = event operation
Channel name of the selected channel