43
3 Operation and visualization
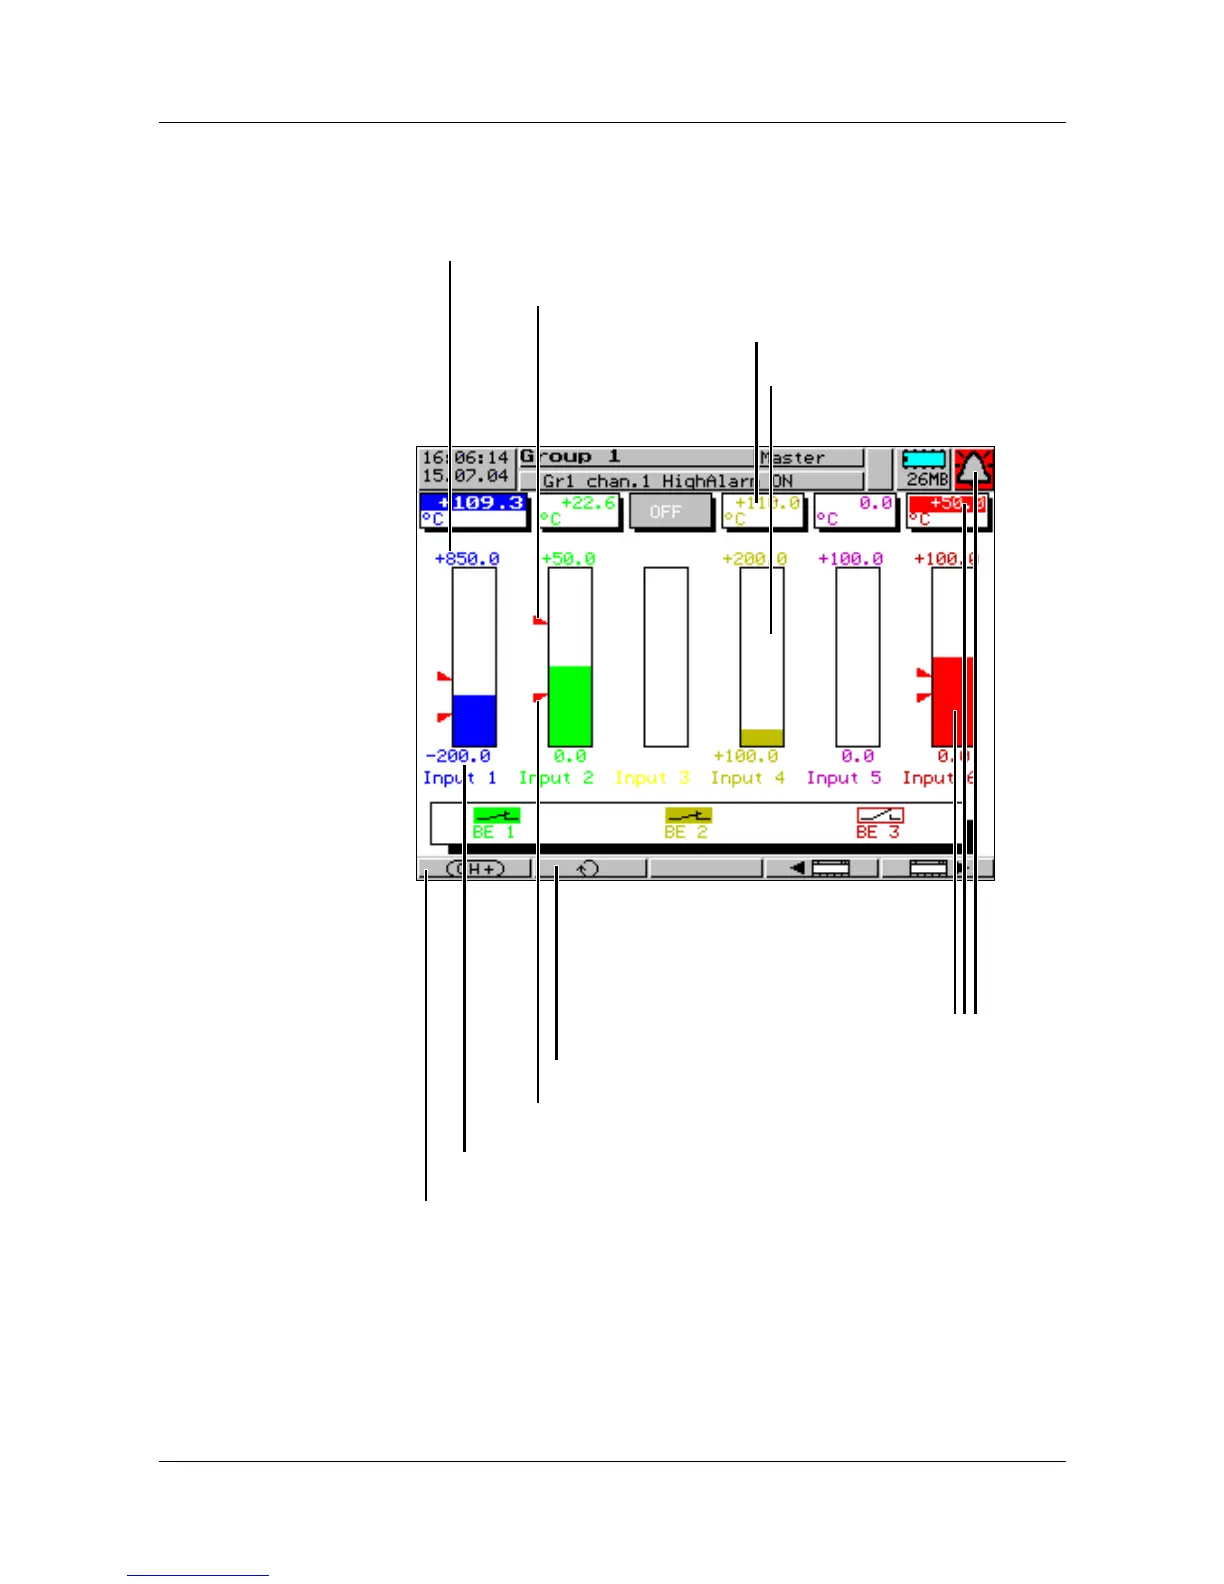
3.2.4 Bar graph representation
In bar graph representation, the latest measurements of the group are shown
as bar graphs, in addition to the numerical display.
Scaling end
Latest measurement (numerical)
Latest measurement as bar graph
Upper limit index
Out-of-limit
On out-of-limit, the color changes to red.
The alarm bell flashes and the numerical
measurement is shown on a red
background.
Low limit index
Scaling start
Select next channel
Switch to the next active group