8. After the survey, the following options are available in the View section below the Statistics section. Select the appropriate
survey type depending on the application.
Result:
l Volume: Displays fluid volume.
l Fluid Composition: Displays fluid composition based on the fluid type described in the Fluid box.
l Fluid Thickness: Displays well fluid thickness.
Post Processing:
l Raw: The measured fluid percentages are not processed.
Note: Selecting processed or raw fluid percentages affects the following data:
l The data displayed in the plate map.
l The data displayed in the Statistics section.
l The data saved to a CSV file on the client PC.
The source microplate survey data is displayed in the main data grid of the Survey dialog box. Either fluid composition or
well fluid thickness (height) will be displayed, depending on which Result radio button is selected. The data will either be
raw, processed (homogeneous), or processed (inhomogeneous) depending on which Post Processing radio button is
selected.
In the Statistics section, the minimum, maximum, average, and CV data from the survey is reported. These statistics are
calculated from raw, processed (homogeneous), or processed (inhomogeneous) survey data depending on which Post
Processing radio button is selected.
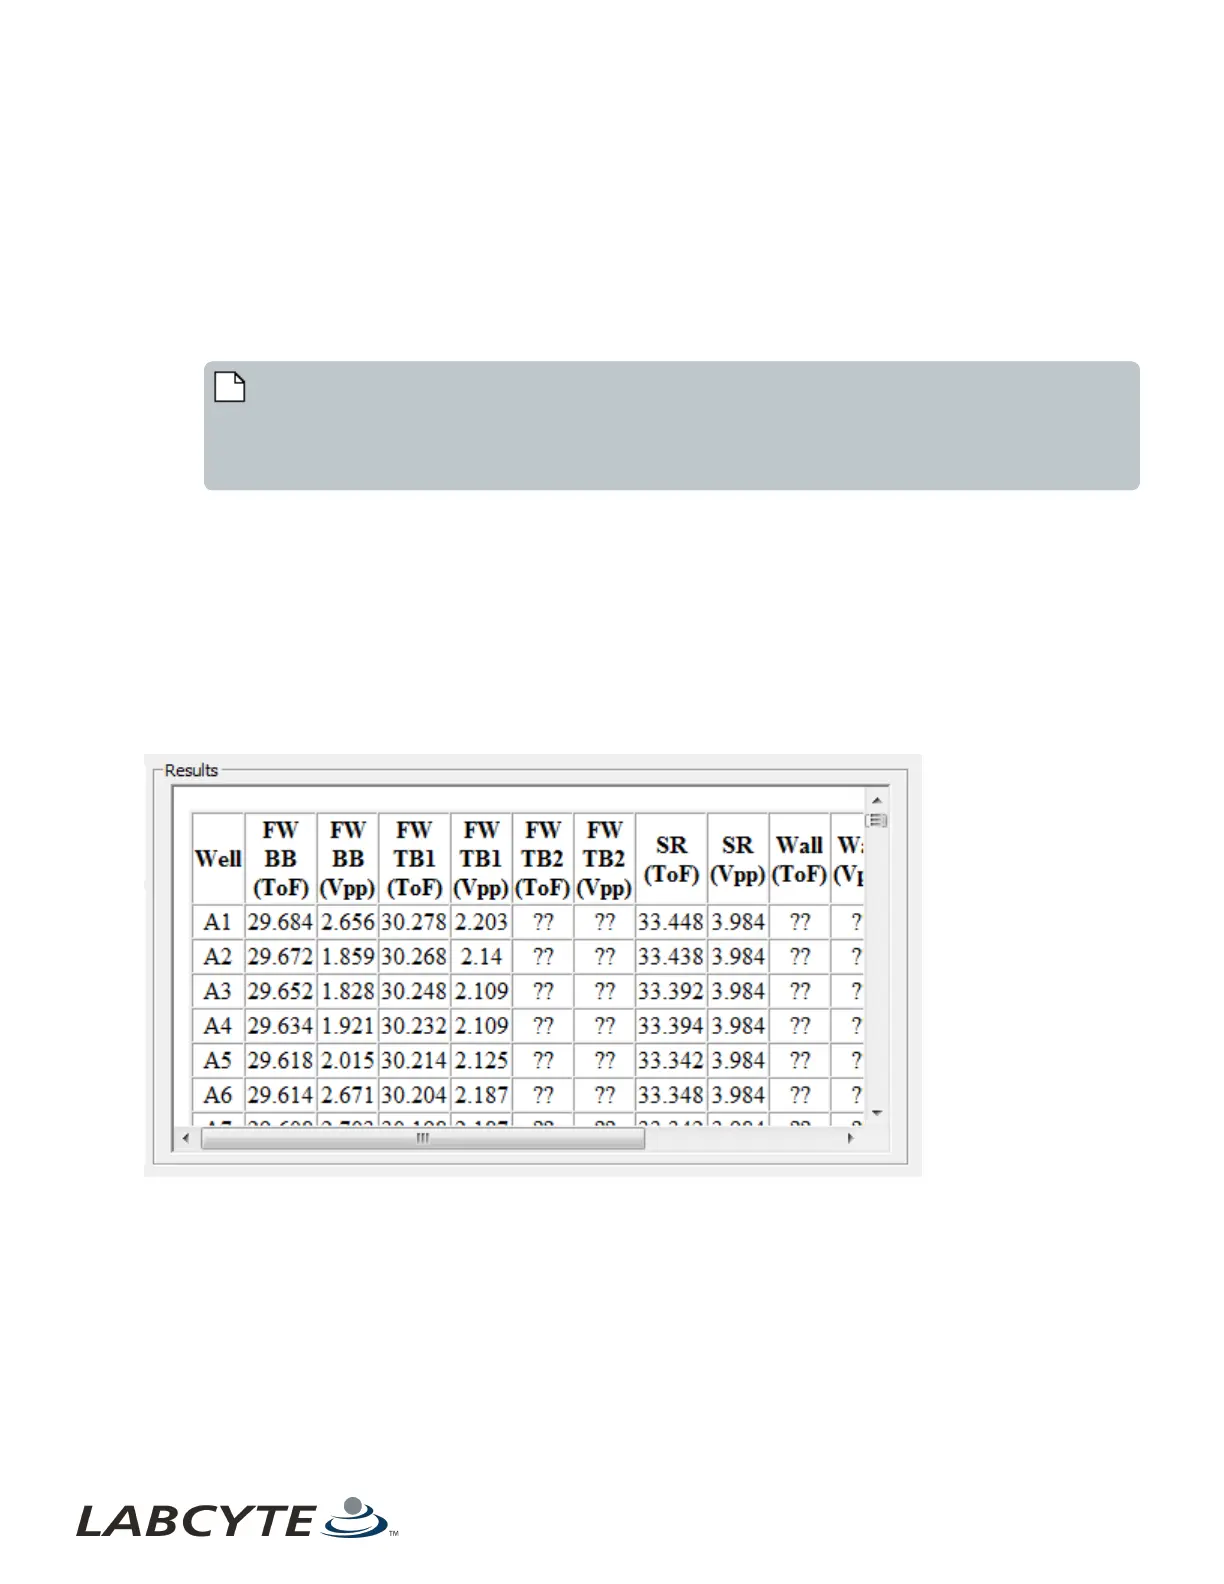
In the Results section, raw data collected during the survey is displayed. This information is used only by Labcyte
personnel during troubleshooting or system analysis.
Figure 86: Diagnostic survey results
9. To save the survey data to the client PC, click the File button and select from the following choices:
l Save | Fluid Composition (.csv)
l Save | Fluid Thickness (.csv)
l Save | Raw (.csv)
Note that File | Save | Fluid Composition will save raw, processed (homogeneous), or processed (inhomogeneous) survey
data, depending on which Post Processing radio button is selected. The Save As dialog box is displayed.
Echo Liquid Handler Software CHAPTER 5 | Software
130