HVM200 Reference Manual Measurement Ranges A-8
A.6 Measurement Ranges
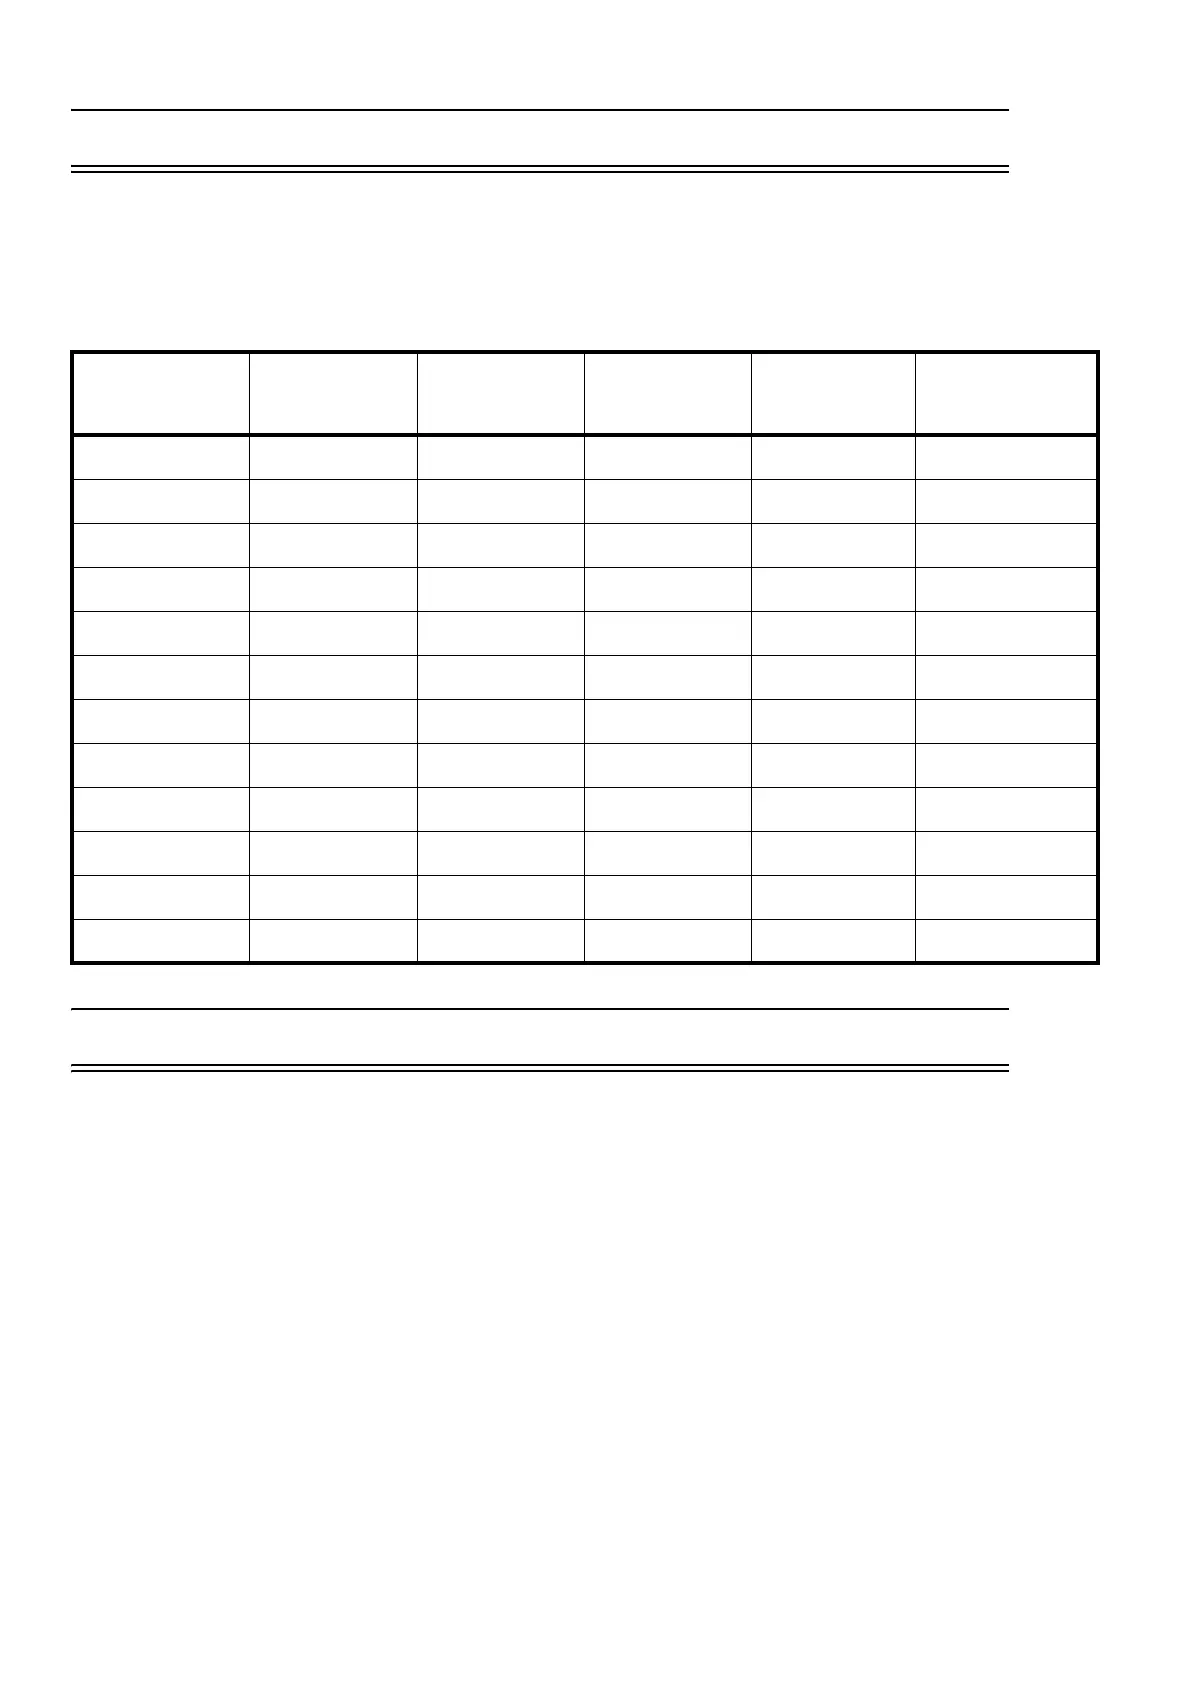
The following table shows the HVM200 dynamic and linearity ranges in root-mean square values. (Peak val-
ues are 1.414 times higher.)
A.7 Frequency Weighting Curves
The following graphs show frequency weighting curves for the HVM200.
Frequency
Weighting
Noise Floor
(typical mV)
Lower Limit
(Under-range
mV)
Lower Limit Lin-
earity Range
(typical mV)
Lower Limit
Linearity Range
(maximum mV)
Upper Limit
(Overload V)
Fa 0.028 0.204 0.092 0.178 5.01
Fb 0.046 0.232 0.133 0.176 5.01
Fc 0.041 0.205 0.116 0.152 5.01
Wb 0.016 0.167 0.073 0.137 5.01
Wc 0.021 0.184 0.089 0.150 5.01
Wd 0.014 0.181 0.072 0.175 5.01
We 0.012 0.193 0.073 0.161 5.01
Wf 0.009 0.185 0.100 0.147 5.01
Wh 0.014 0.087 0.042 0.090 5.01
Wj 0.023 0.167 0.077 0.151 5.01
Wk 0.018 0.144 0.073 0.121 5.01
Wm 0.017 0.103 0.060 0.077 5.01