autoranging; the bar graph scale changing in 10dB steps when the reading goes outside
±6dB of the centre. This leaves a ‘guard band’ of 2dB so that no reasonably steady signal
should cause the range to ‘hunt’ up and down. On wildly varying signals, though, manual
range setting may be found useful, and the
and keys on the LA102 change the
range, automatically disabling autoranging. To hold the current range, press one and then
the other. To re-enable autoranging just press the appropriate function key again or press
twice. Range setting Level range setting Manual range setting Range keys Input level
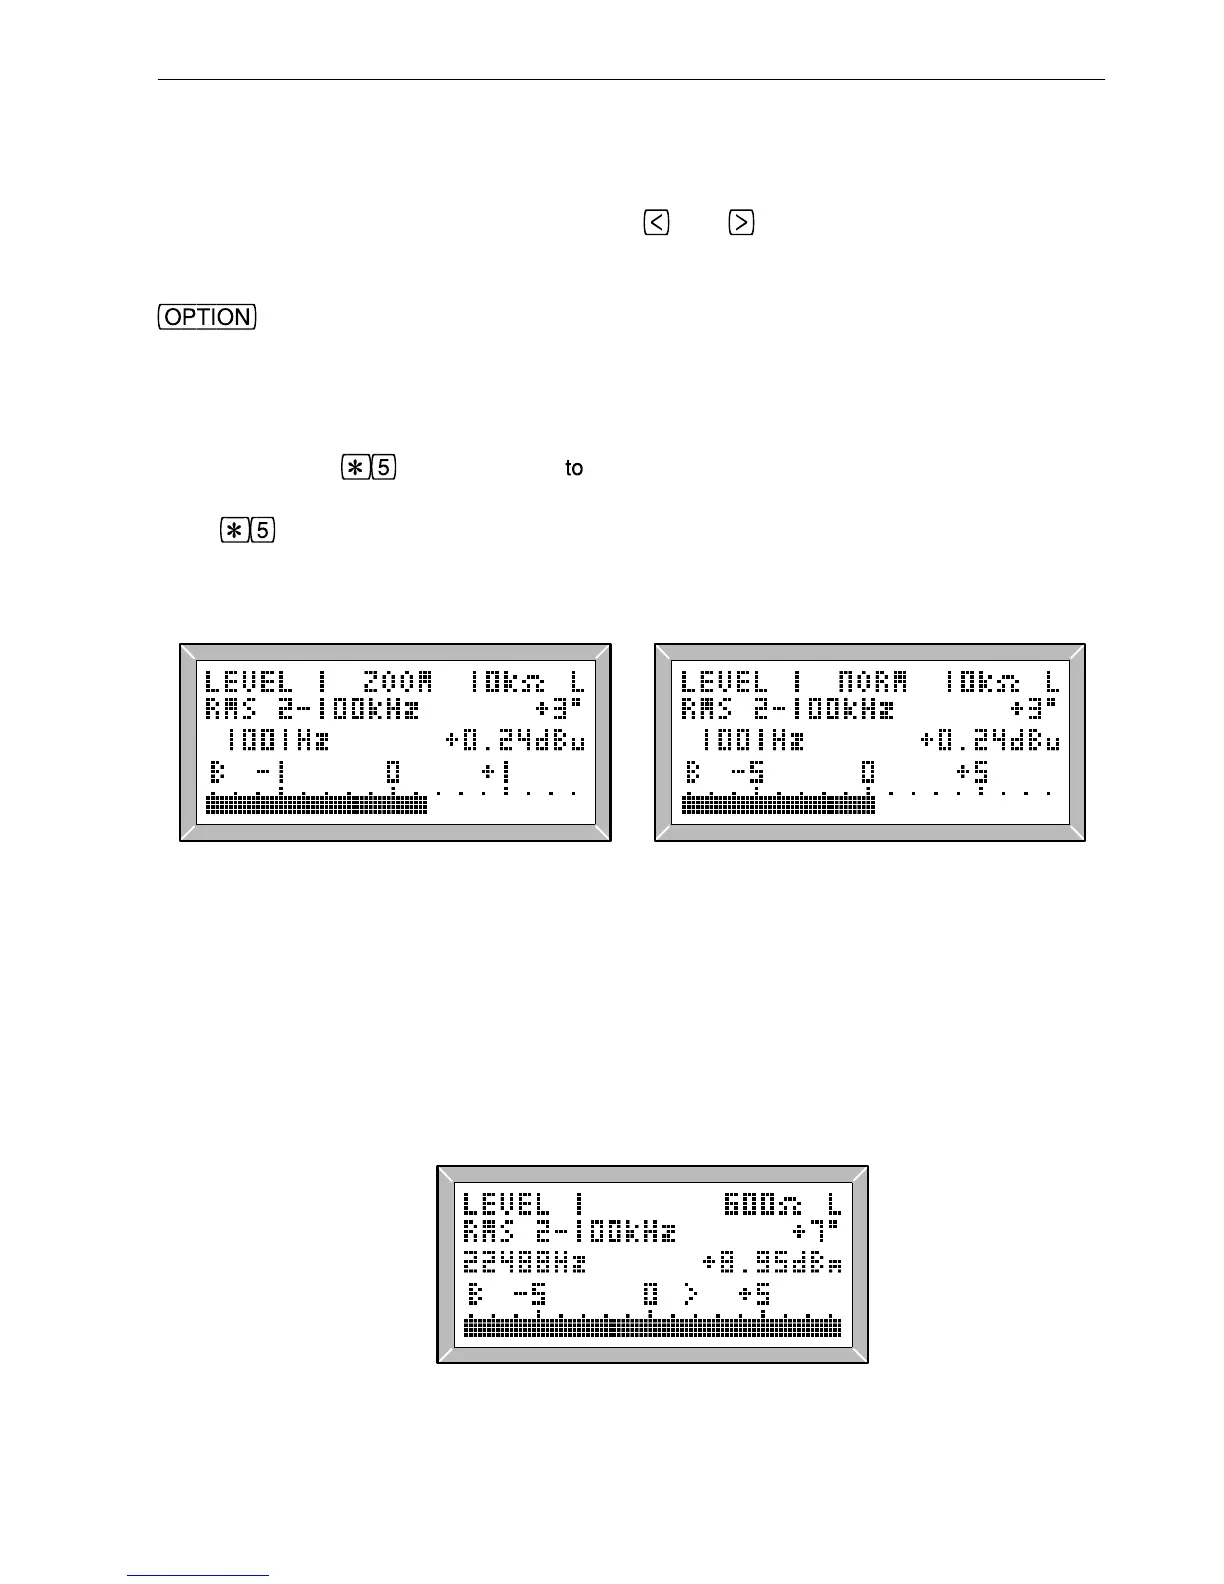
The bar graph shows the absolute level in dBu or dBV and is normally labelled in 5dB
steps, with each pixel representing a 0.2dB step. This is about as good as an analogue
meter, taking into account the very low levels of zero error and non-linearity, but for
greater precision
can be pressed expand the bar graph scale by a factor of 5. The
1dB steps will now be labelled, with each pixel representing 1/25th of a dB (0.04dB).
Press
again to return to the normal scale. ZOOM (fig. 2.3) is displayed for a second
when it is selected, and
NORM (fig. 2.4) when it is cancelled. For accurate readings on
steady signals the numerical readout is preferred, reading to 0.01dB.
Expanded bar graph Magnified bar
graph
Bar graph scale Level resolution Bar graph magnification Level range Bar graph units dB scale
Fig. 2.3 Zoom bar graph Fig. 2.4 Normal bar graph
The LA102 indicates if the input level is too high or too low for the range by flashing an
arrow (fig. 2.5). If the level is too high (flashing >) the displayed reading is incorrect
because the LA102 is overloaded, while a low level (flashing <) indicates that accuracy is
being lost (when the level is more than 30dB below the centre scale value). In either case
the range should be changed if possible (an LA102 will change range automatically
unless it has been locked).
Level too high Level too low
Fig. 2.5 Flashing overflow indicator
17
2. Manual Operation
 Loading...