Vel2, calculating RI.
5. Roll the trackball and press Set to begin a new RI measurement. You can
measure a maximum of four groups of data. The outcome will be displayed in
the measurement result window.
6. Press Measure to finish and exit.
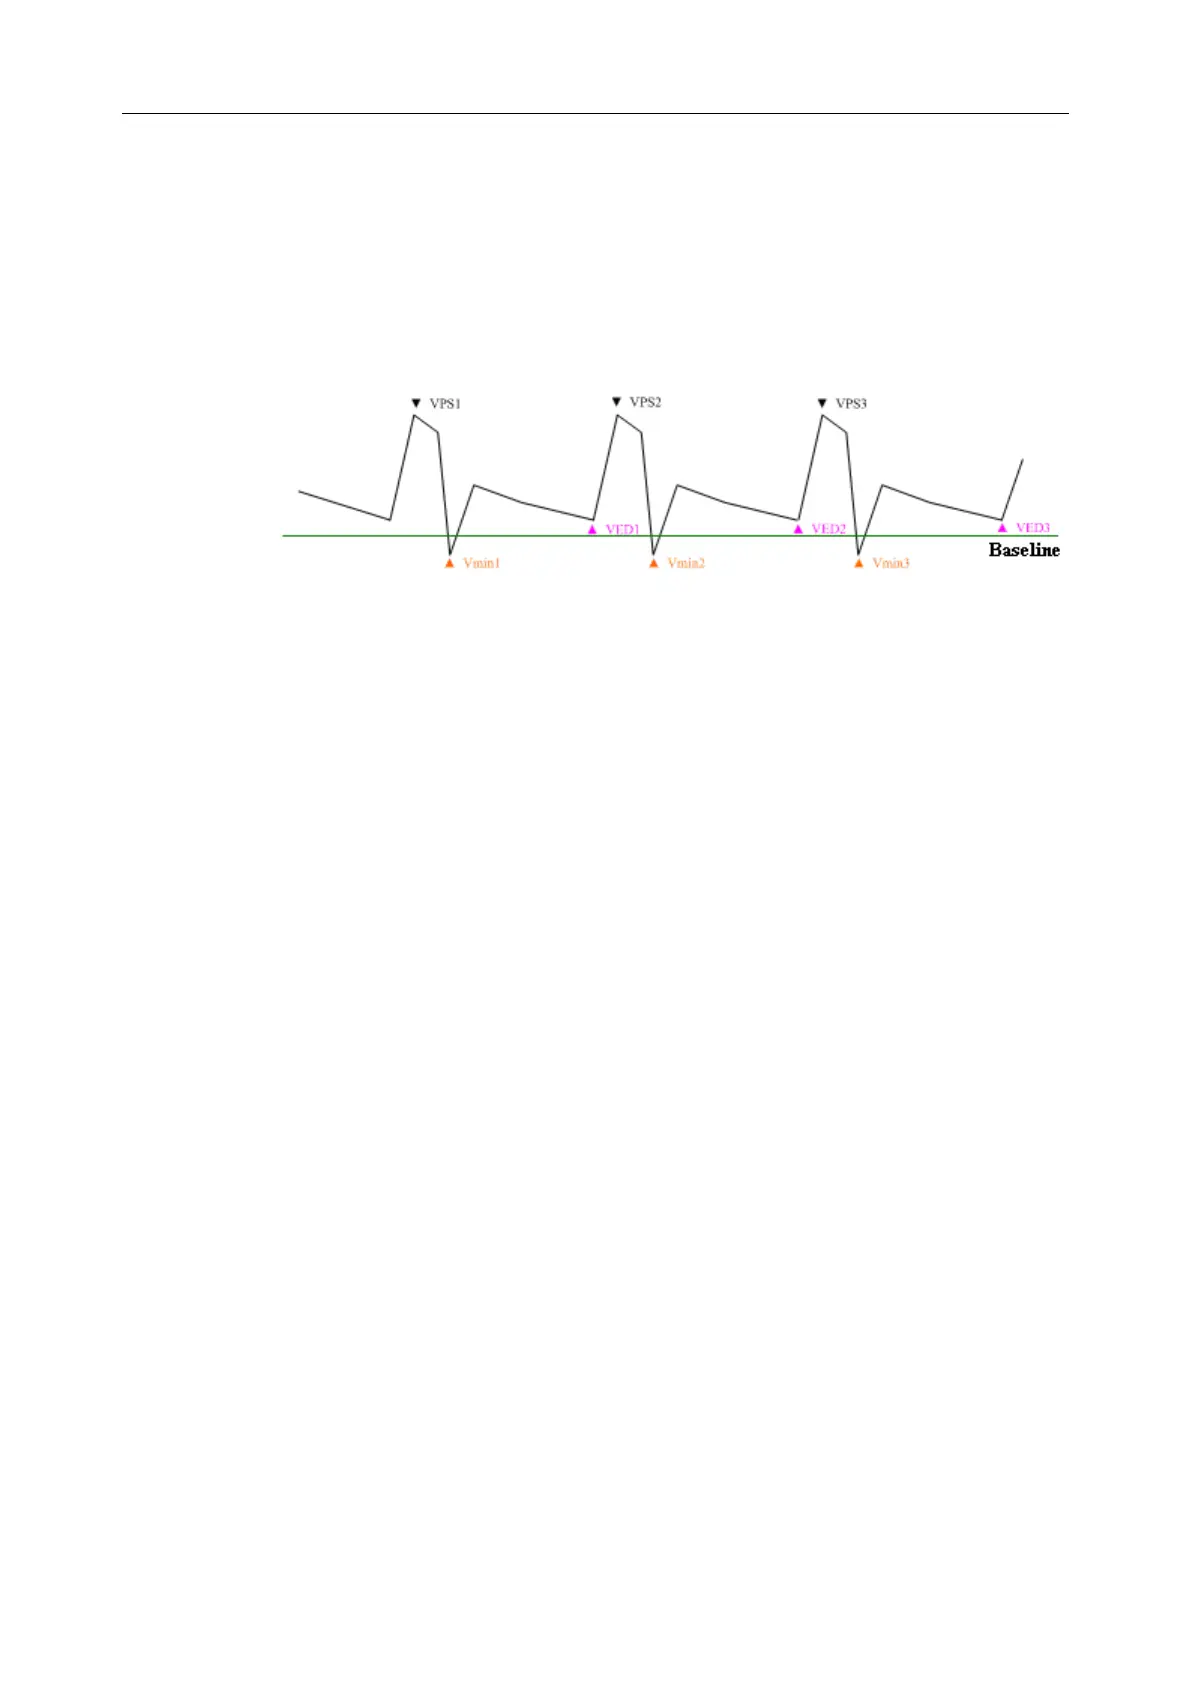
The trace in PW mode is shown below:
Figure 6-19 Trace Diagram
Where,
➢ VPS is the maximum velocity in the cycle;
➢ VED is the minimum velocity in the cycle;
➢ V
min
is the minimum absolute value.
NOTE:
1. The trace function is effective above the baseline only.
2. Freeze the system before performing the tracing function.
To perform D Trace function (manual tracing)
1. Press Measure to activate a measurement cursor “+”.
2. Roll the trackball to highlight D Trace and press Set.
3. Select Manual and a “+” is displayed.
4. Roll the trackball and press Set to anchor the start point.
5. Roll the trackball to trace along the Doppler wave forward, or press Back to
erase the trace backward.
6. Press Set to anchor the end point, the system displays the results of PS, ED,
RI, S/D, PI, TAMAX, etc. in measurement result window.
7. Roll the trackball and press Set to begin a new tracing measurement. You can
measure a maximum of four groups of data. The outcome will be displayed in
the measurement result window.
8. Press Measure to finish and exit.
 Loading...