3.10 Data output
756/831 KF Coulometer, Instructions for Use
42
3.10.2 Additional possibilities for report outputs
In addition to the reports which are printed at the end of the titration, various other reports
can be put out. There are 2 possibilities for selecting the reports:
1) <PRINT><←/→><ENTER> Cursor is pressed repeatedly until the desired report
appears in the display.
2) <PRINT><keyX><ENTER> key X is the key under which the appropriate data
are entered.
Report Display on
<PRINT><→
>
<Key X>
Result report result –
Curve water vs. time water crv –
Curve rate vs. time rate crv –
Curve measured voltage vs. time meas crv –
Combined curve water/rate vs. time comb –
Measuring point list mplist –
Parameter report param PARAM
Calculation report with formulas and calculation values calc –
Calculation values C01...C19 C-fmla C-FMLA
Content of key <DEF> def DEF
Statistics report with the individual results statistics STATISTICS
Current sample data smpl data SMPL DATA
Sample data from silo memory silo SILO
Full silo calculations report scalc full –
Short silo calculations report scalc srt –
Configuration report configuration CONFIG
Contents of the method memory with memory require-
ments of the individual methods and the remaining
bytes
user methods USER METH
Complete report sequence of the last determination, as
defined under the key <DEF> in the method
_ REPORTS
All possible reports all
Form feed for external printers ff
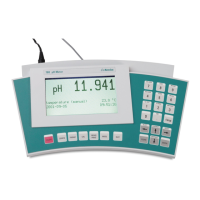
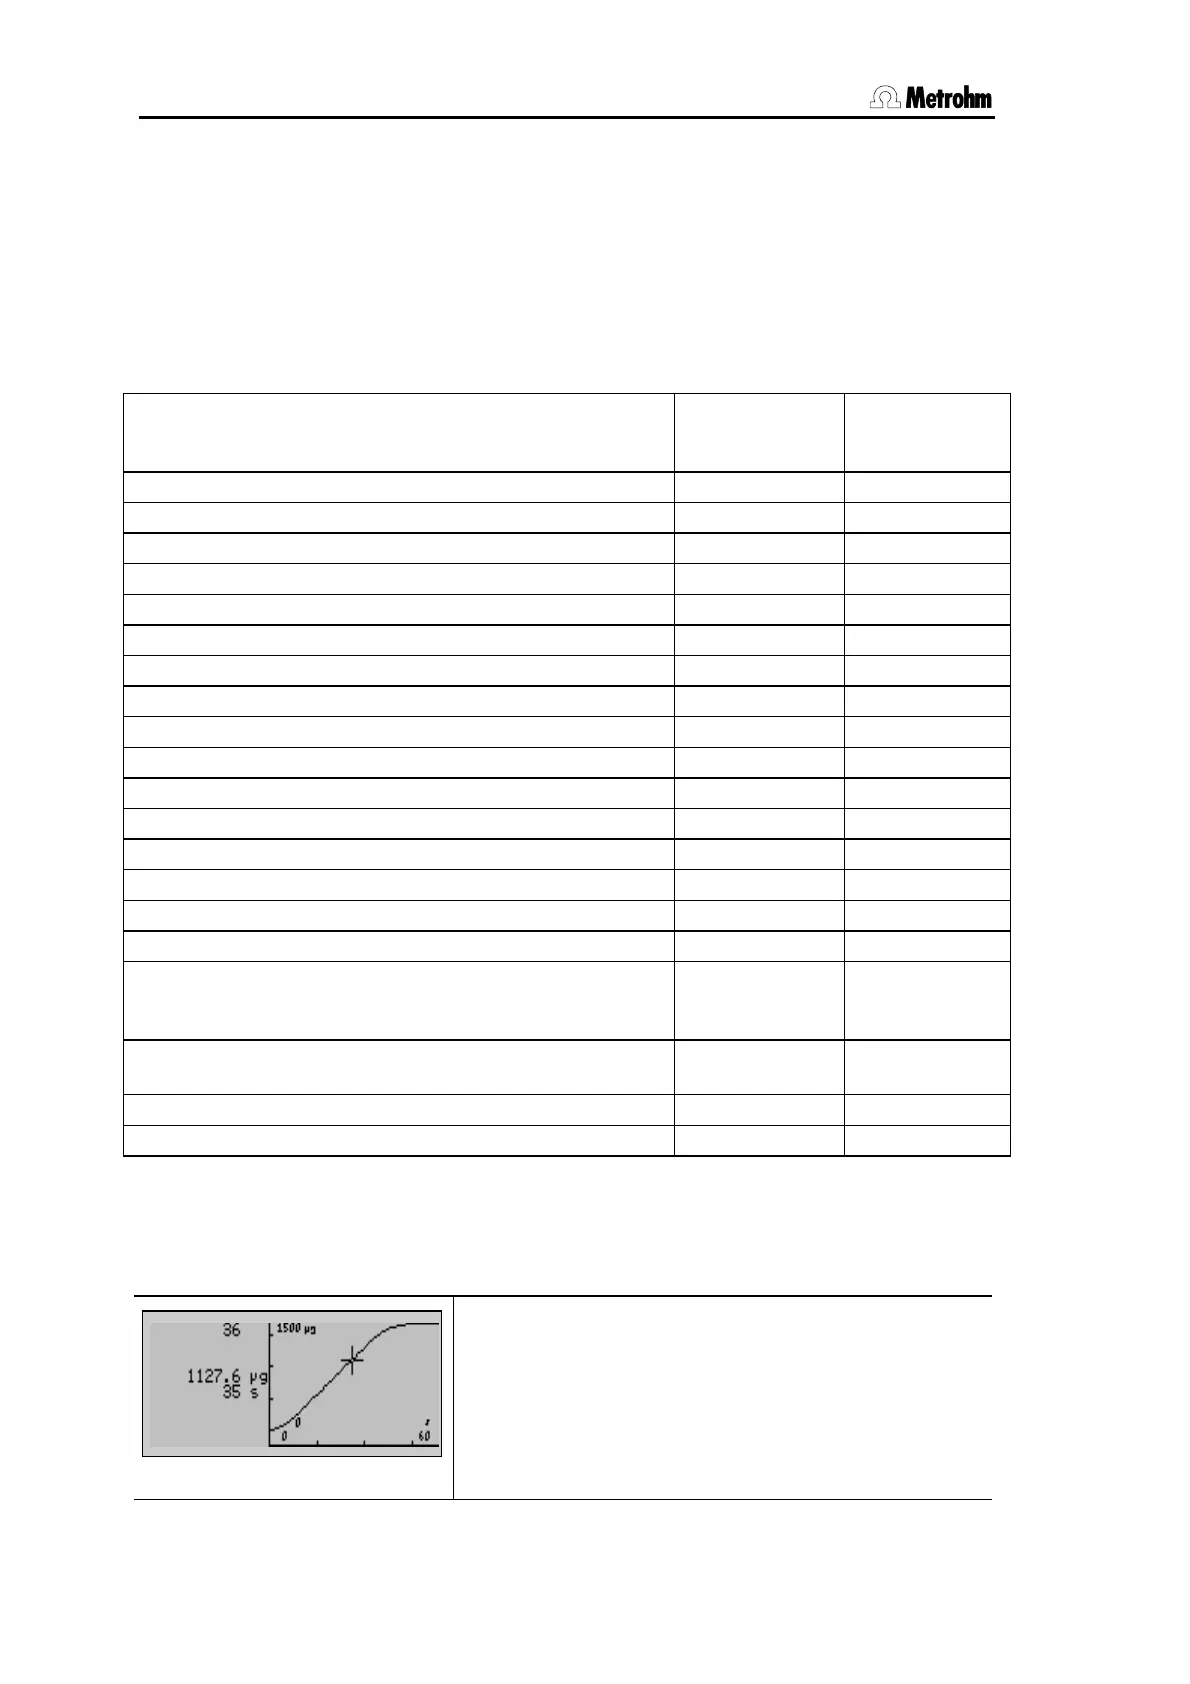
3.10.3 Display of the titration curve
After the titration, the curve can be viewed.
Switch between
curve and result display with keys <←> and <→>.
You can trace the curve with keys <↑> and <↓>. In
the text field to the left of the curve the index of the cur-
rent measured value is displayed in the first line. In the
subsequent lines, the corresponding measured values
(water and time) are shown.