Principles of Operation
24 0112-0115 F
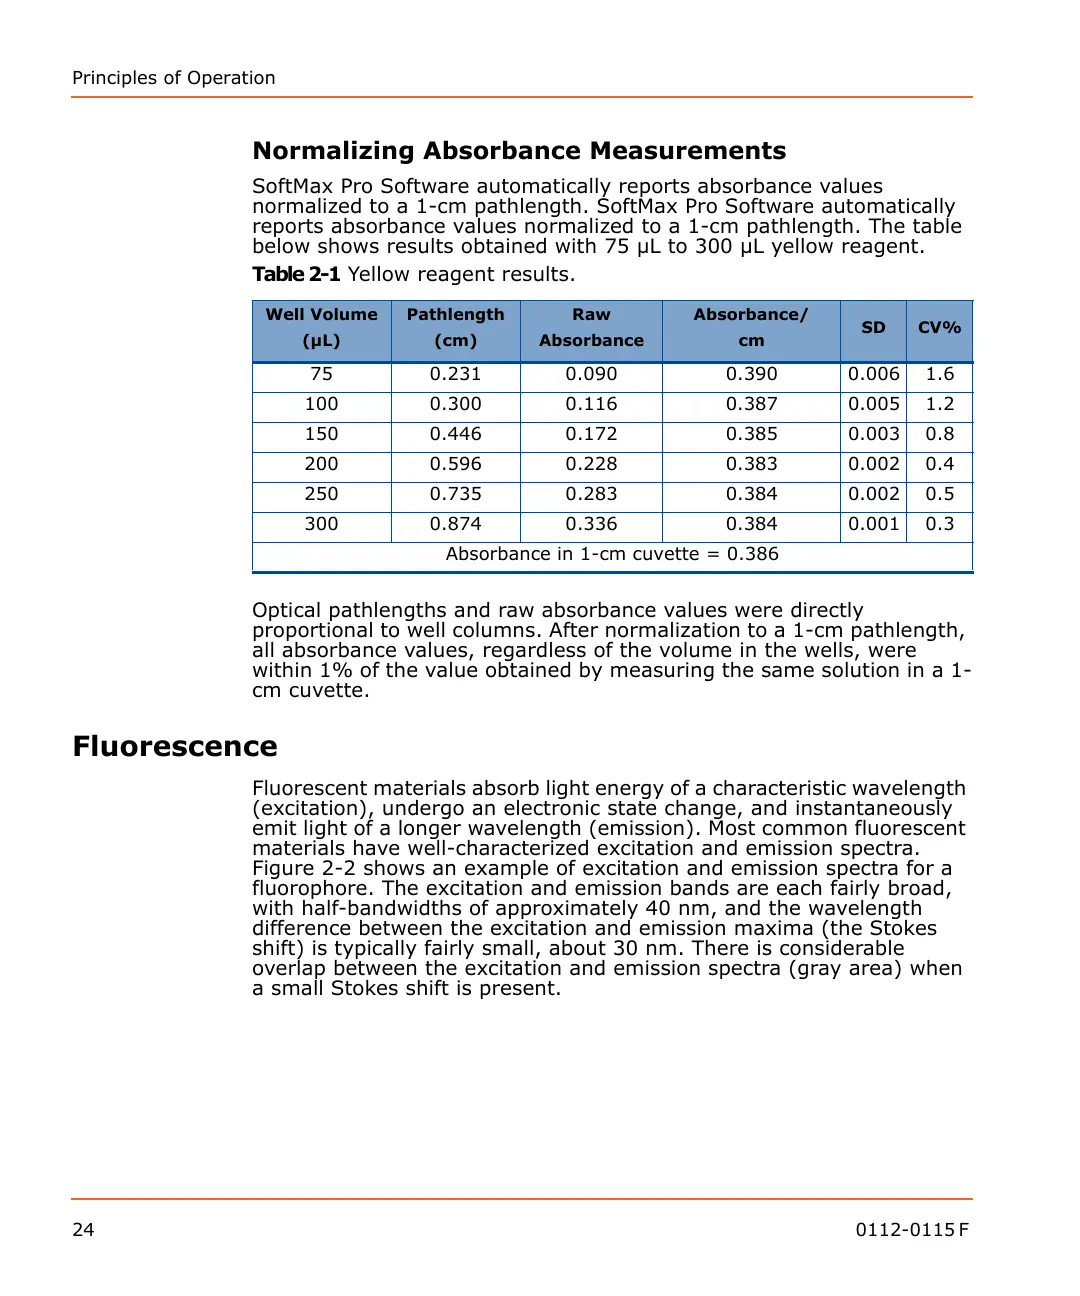
Normalizing Absorbance Measurements
SoftMax Pro Software automatically reports absorbance values
normalized to a 1-cm pathlength. SoftMax Pro Software automatically
reports absorbance values normalized to a 1-cm pathlength. The table
below shows results obtained with 75 µL to 300 µL yellow reagent.
Optical pathlengths and raw absorbance values were directly
proportional to well columns. After normalization to a 1-cm pathlength,
all absorbance values, regardless of the volume in the wells, were
within 1% of the value obtained by measuring the same solution in a 1-
cm cuvette.
Fluorescence
Fluorescent materials absorb light energy of a characteristic wavelength
(excitation), undergo an electronic state change, and instantaneously
emit light of a longer wavelength (emission). Most common fluorescent
materials have well-characterized excitation and emission spectra.
Figure 2-2 shows an example of excitation and emission spectra for a
fluorophore. The excitation and emission bands are each fairly broad,
with half-bandwidths of approximately 40 nm, and the wavelength
difference between the excitation and emission maxima (the Stokes
shift) is typically fairly small, about 30 nm. There is considerable
overlap between the excitation and emission spectra (gray area) when
a small Stokes shift is present.
Table 2-1 Yellow reagent results.
Well Volume
(µL)
Pathlength
(cm)
Raw
Absorbance
Absorbance/
cm
SD CV%
75 0.231 0.090 0.390 0.006 1.6
100 0.300 0.116 0.387 0.005 1.2
150 0.446 0.172 0.385 0.003 0.8
200 0.596 0.228 0.383 0.002 0.4
250 0.735 0.283 0.384 0.002 0.5
300 0.874 0.336 0.384 0.001 0.3
Absorbance in 1-cm cuvette = 0.386
 Loading...