SpectraMax M3, M4, M5, and M5
e
Multi-Mode Microplate Readers
0112-0115 F 49
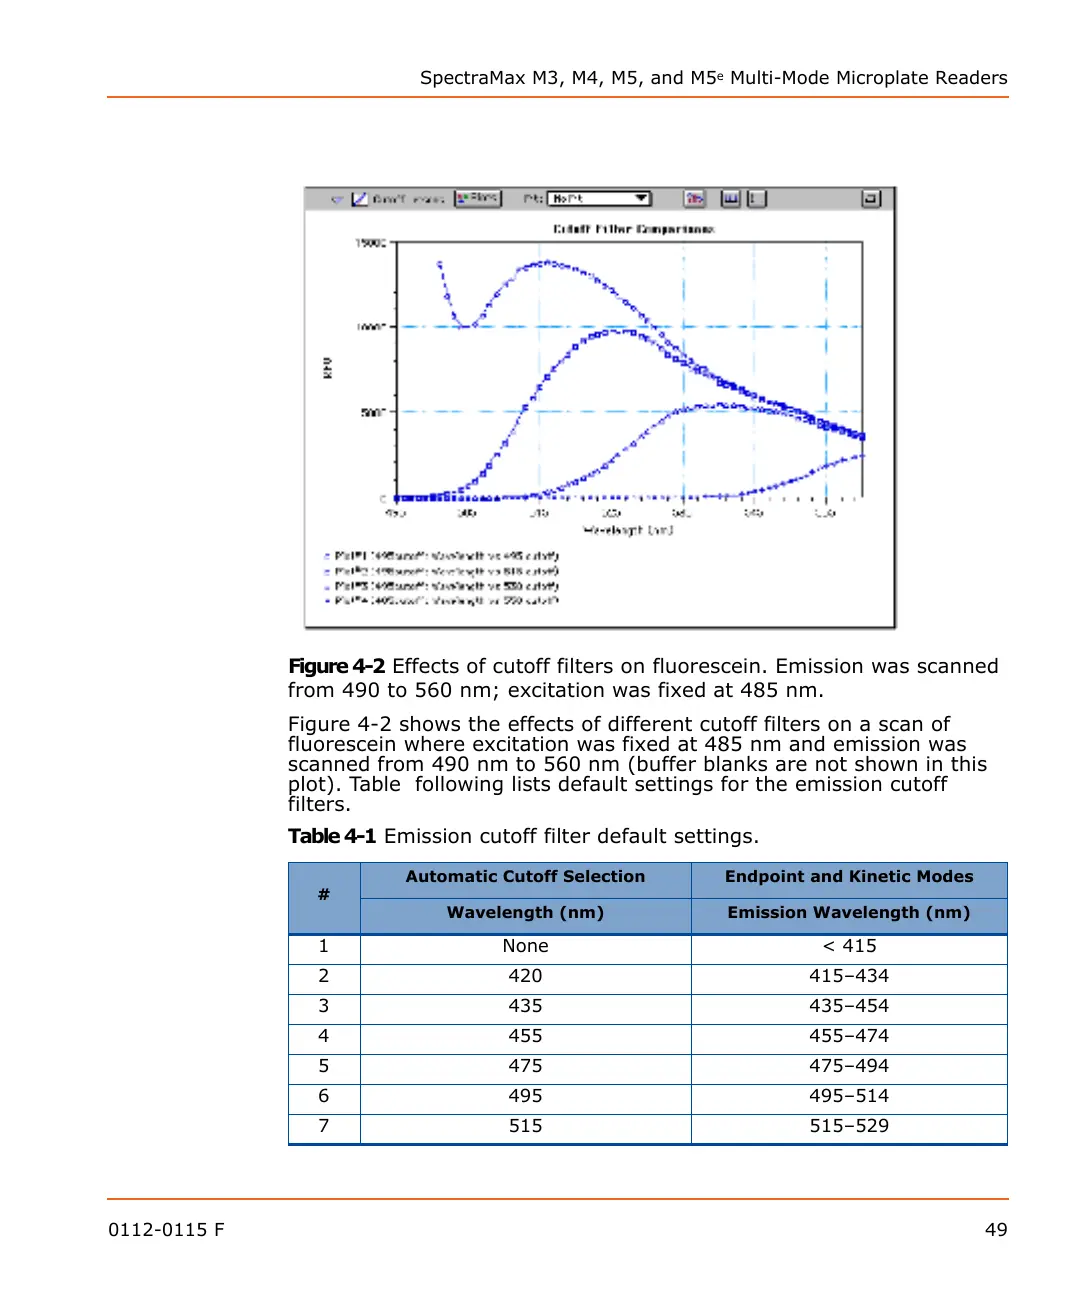
Figure 4-2 Effects of cutoff filters on fluorescein. Emission was scanned
from 490 to 560 nm; excitation was fixed at 485 nm.
Figure 4-2 shows the effects of different cutoff filters on a scan of
fluorescein where excitation was fixed at 485 nm and emission was
scanned from 490 nm to 560 nm (buffer blanks are not shown in this
plot). Table following lists default settings for the emission cutoff
filters.
Table 4-1 Emission cutoff filter default settings.
#
Automatic Cutoff Selection Endpoint and Kinetic Modes
Wavelength (nm) Emission Wavelength (nm)
1 None < 415
2 420 415–434
3 435 435–454
4 455 455–474
5 475 475–494
6 495 495–514
7 515 515–529
 Loading...