Alarm
Limits
Changed
Indicator
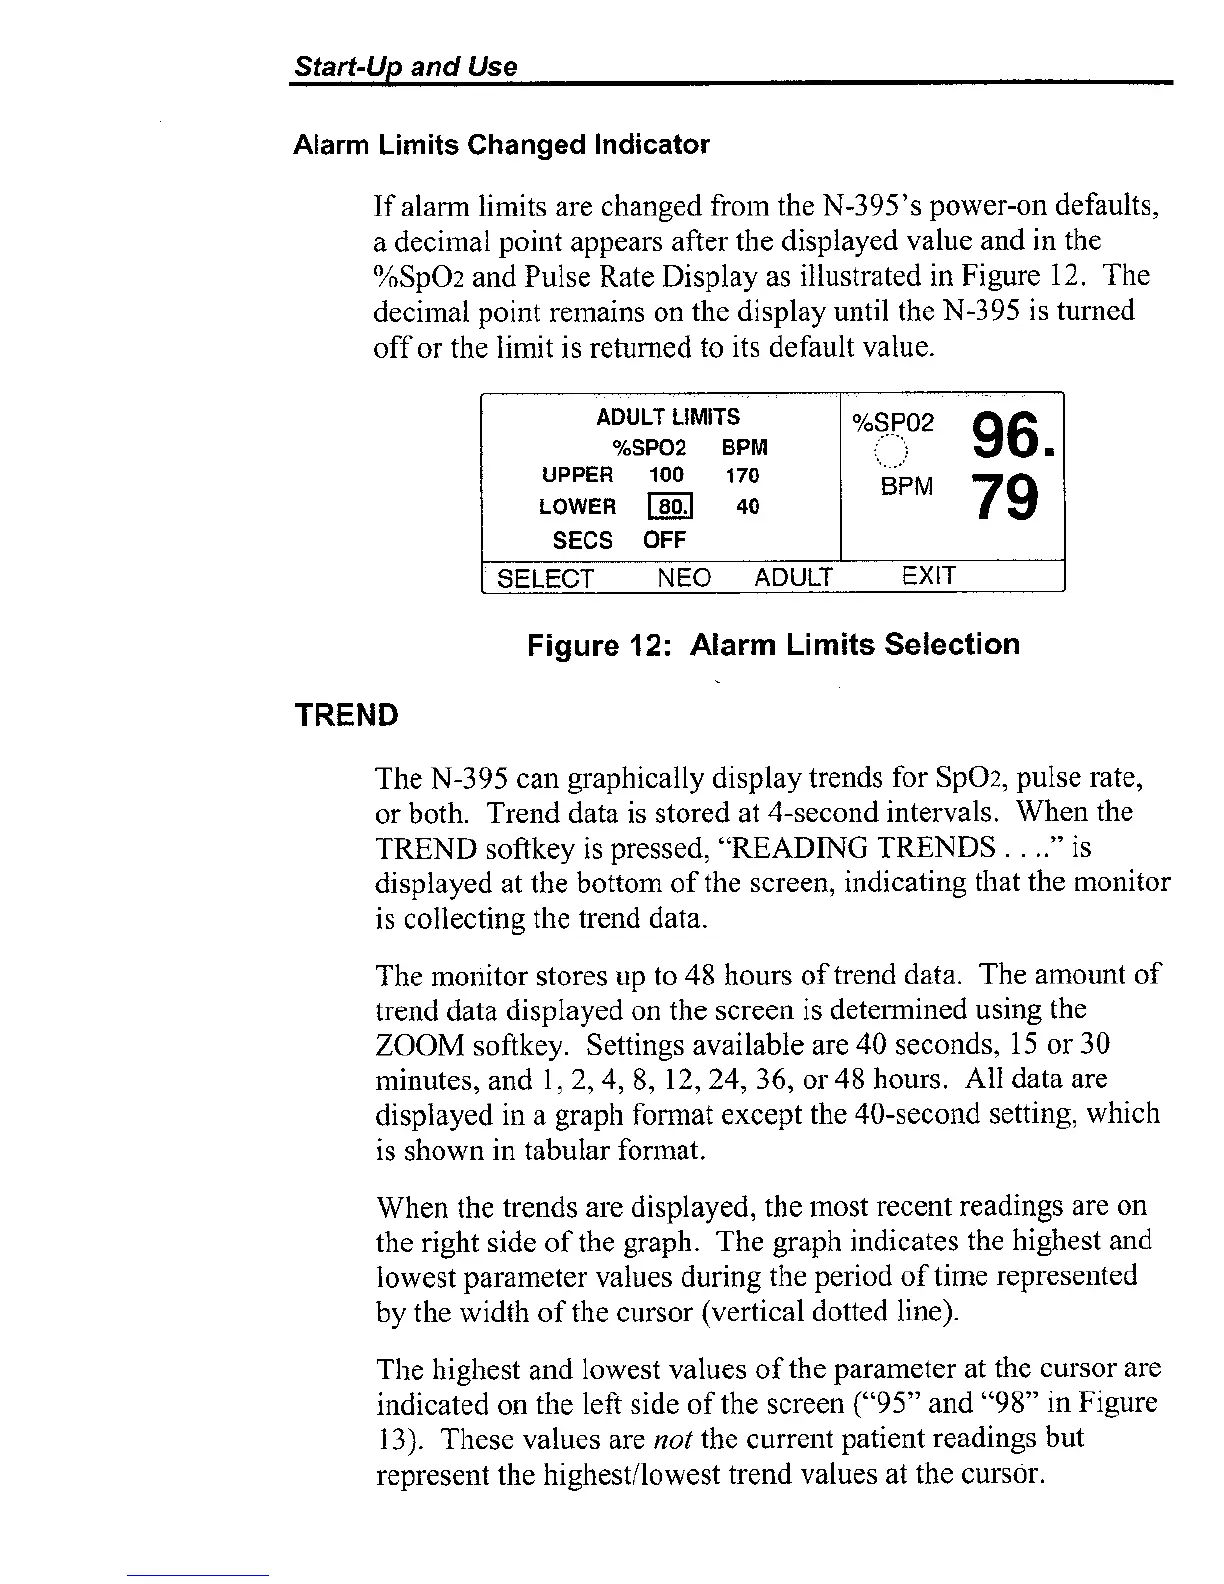
If alarm limits are chai~ged from the N-395's power-on defaults,
a decimal point appears after the displayed value and in the
%SpOz and Pulse Rate Display as illustrated in Figure 12. The
decimal point remains on the display until the N-395 is turned
off or the limit is returned to its default value.
Figure
12:
Alarm
Limits
Selection
TREND
I
ADULT
LIMITS
%SP02
BPM
UPPER
100 170
LOWER
40
SECS
OFF
The N-395 call graphically display trends for SpO2, pulse rate,
or both.
Trend data is stored at 4-second intervals. When the
TREND softkey is pressed, "READING TRENDS
.
.
.."
is
displayed at the bottom of the screen, indicating that the monitor
is
collectiilg the trend data.
,...
.
.
;
,,
I-
.
.
96.
..._.'
BPM
79
The monitor stores up to 48 hours of trend data. The amount of
trend data displayed on the screen is
determined using the
ZOOM
softkey. Settings available are 40 seconds,
15
or 30
minutes, and
1,
2,4, 8, 12, 24, 36, or 48 hours. All data are
displayed in a graph
fonnat except the 40-second setting, which
is shown in tabular
forinat.
[
SELECT NEO ADULT
EXIT
When the trends are displayed, the most recent readings are on
the right side of the graph. The graph indicates the highest and
lowest parameter values during the period of time
represeilted
by the width of the cursor (vertical dotted line).
The highest and lowest values of the parameter at the cursor are
indicated on the left side of the screen ("95" and "98" in Figure
13).
These values are
not
the current patient readings but
represent the
highestllowest trend values at the cursdr.