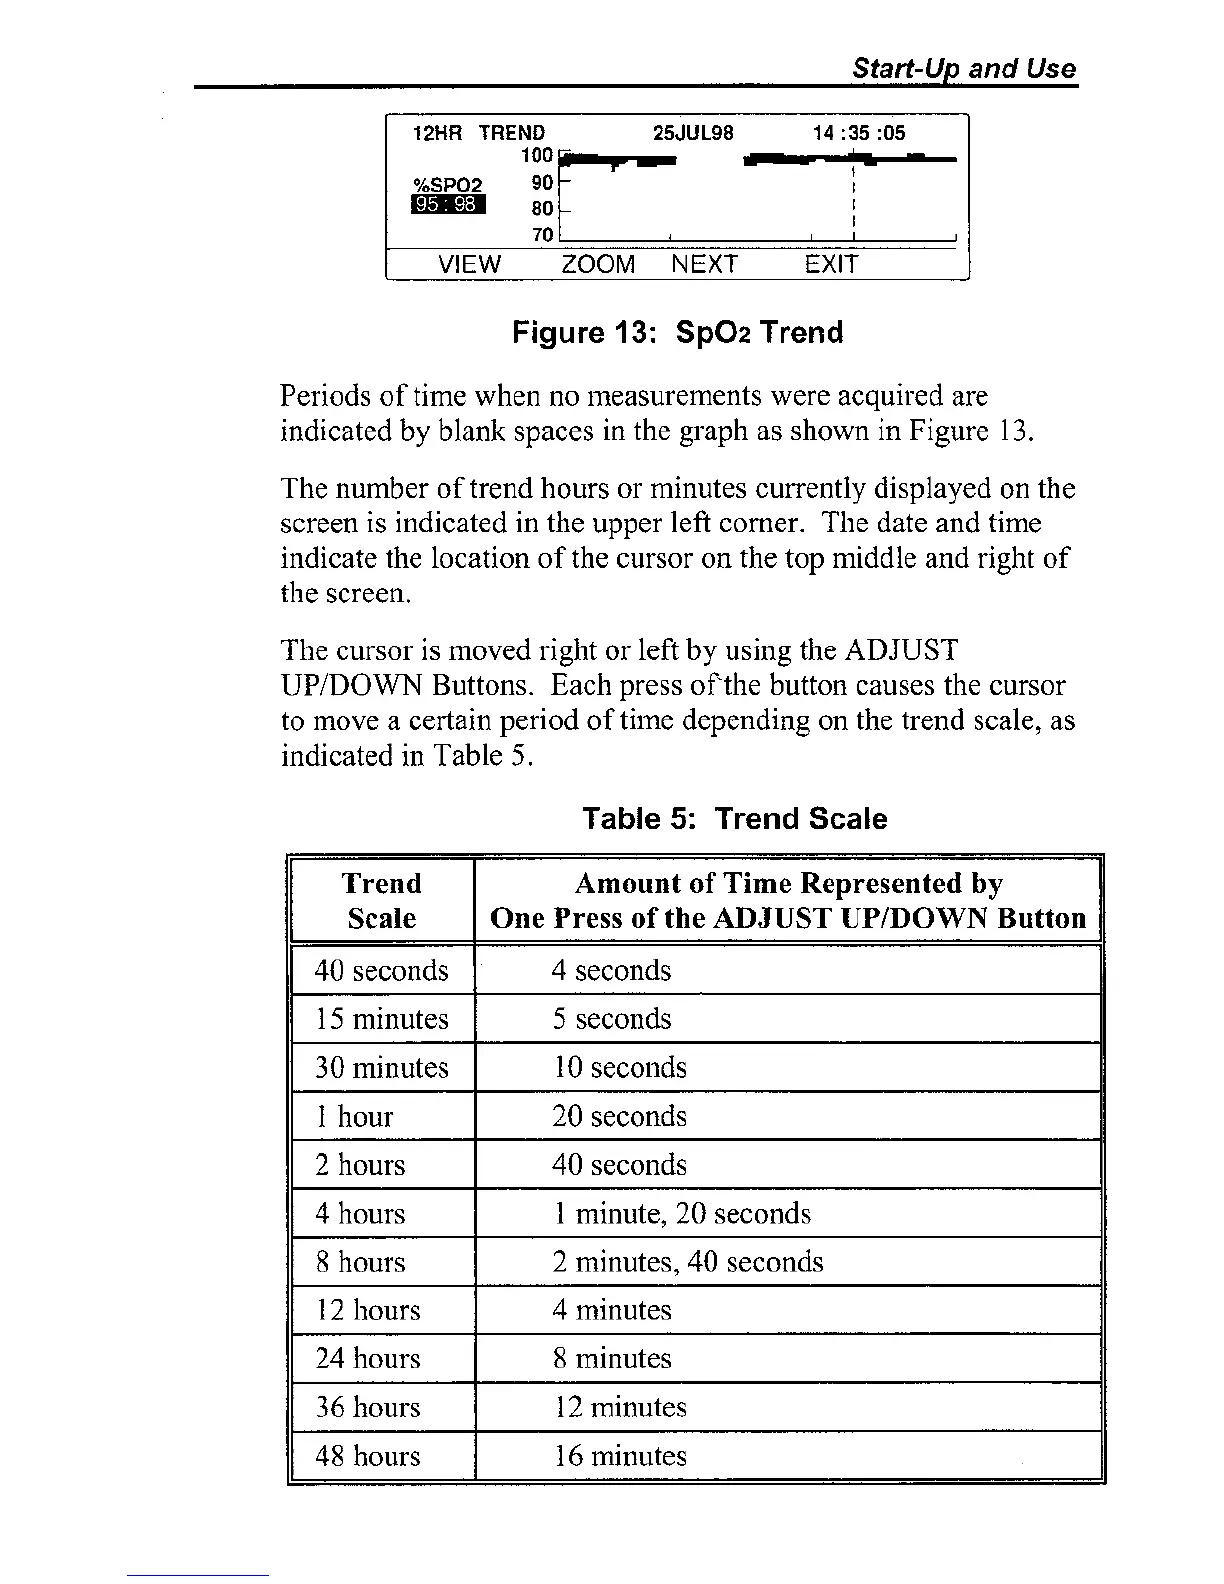
Figure
13:
Sp02
Trend
Periods of time when
110
measurements were acquired are
indicated by blank spaces in the graph as shown in Figure
13.
The number of trend hours or minutes currently displayed on the
screen is indicated in the upper left corner. The date and time
indicate the location of the cursor on the top middle and right of
the screen.
The cursor is moved right or left by using the ADJUST
UPIDOWN
Buttons. Each press
of
the button causes the cursor
to move a certain period of time depending on the trend scale, as
indicated in Table
5.
Table
5:
Trend
Scale