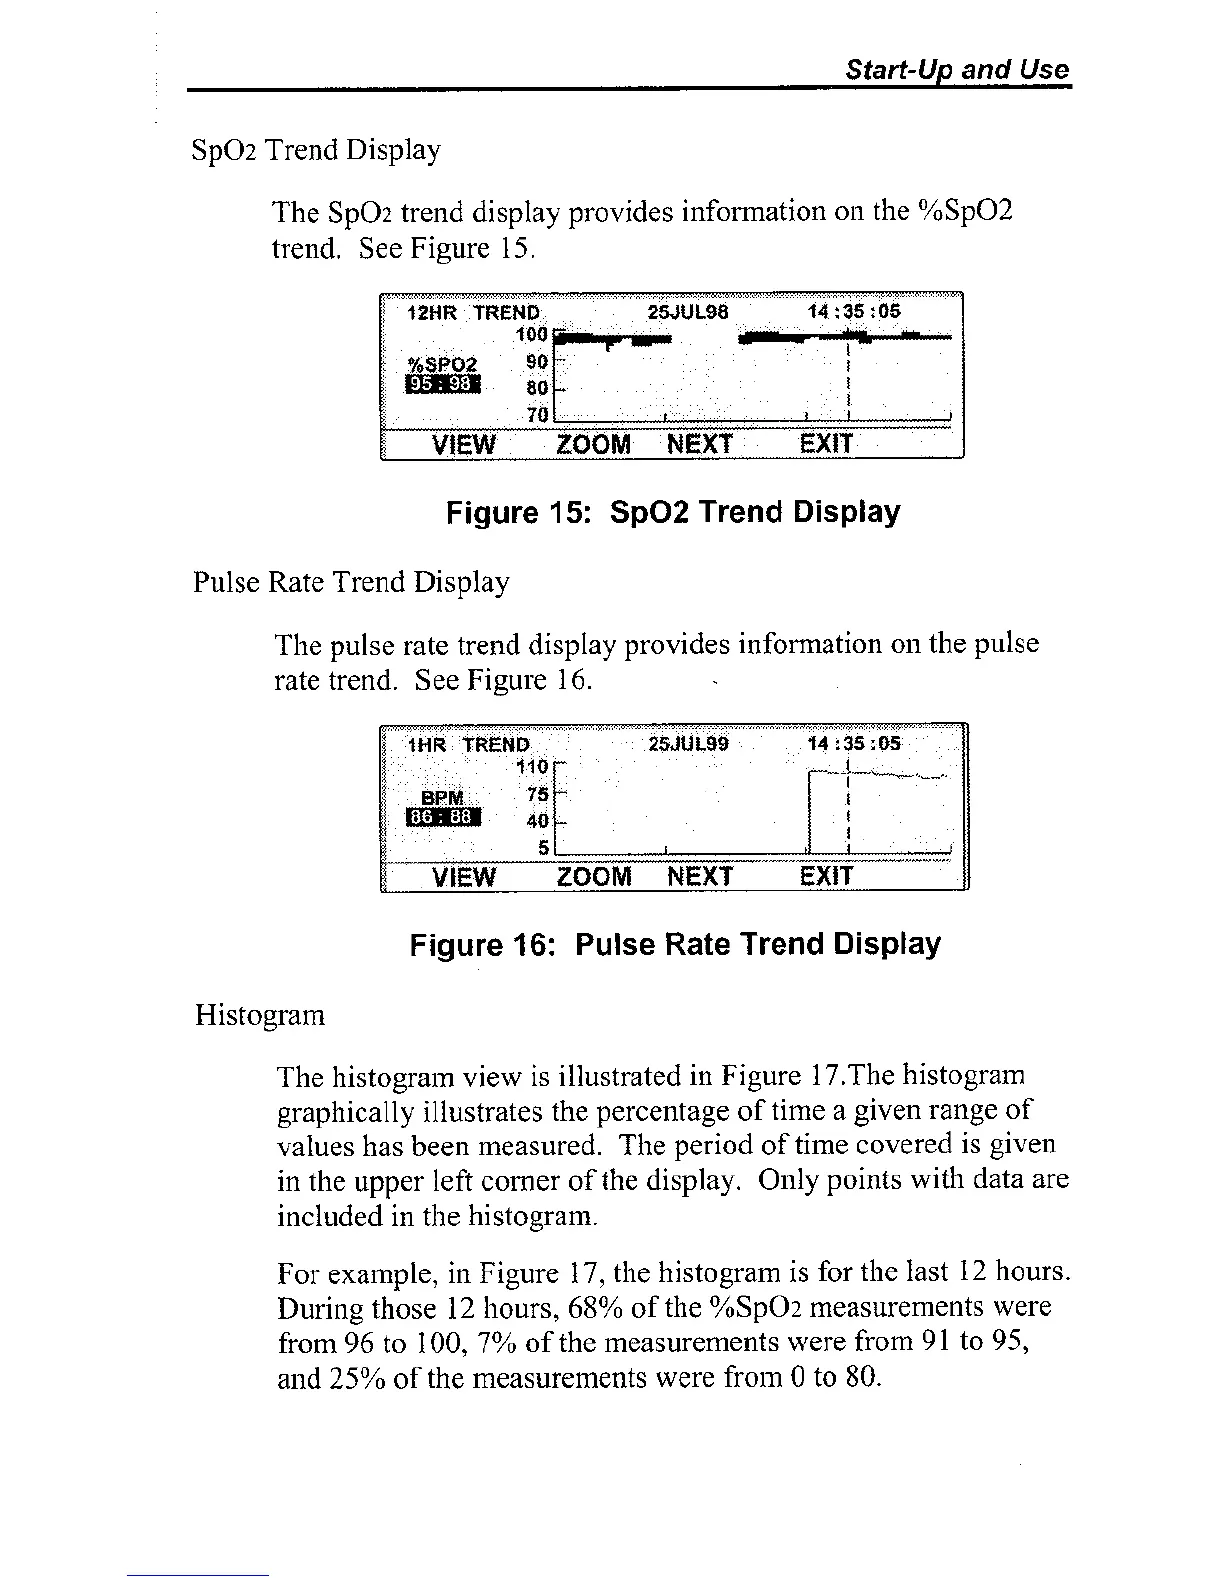
Sp02 Trend Display
The
SpOz trend display provides information on the %Sp02
trend. See Figure
1
5.
Figure
15:
Sp02
Trend
Display
Pulse Rate Trend Display
The pulse rate trend display provides information on the pulse
rate trend. See Figure 16.
Figure
16:
Pulse Rate
Trend
Display
Histogram
The histograin view is illustrated in Figure
17.The histogram
graphically illustrates the percentage of time a given range of
values has been measured. The period of tiine covered is given
in the upper left comer of
tlie display. Only points with data are
included in the histogram.
For example, in Figure 17, the histogram is for
tlie last 12 hours.
During those
12
hours,
68%
of the %Sp02 measurements were
from
96
to 100, 7% of the measurements were from 9
1
to 95,
and
25%
of the measureinents were froin 0 to 80.