Con tents
......................
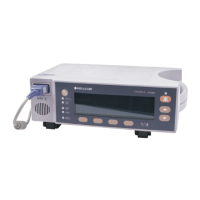
Figure 1
:
N-395 Front Panel Display (Pleth View) 5
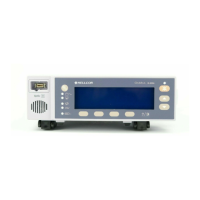
Figure 2: N-395 Rear Panel
........................................................
6
Figure 3: GCX Mounting Plate
..................................................
13
Figure 4: GCX Poly-mount (vertical wall mount
with 19-inch channel)
..............................................
14
Figure 5: GCX Poly-mount (horizontal wall mount
with rail adapter)
.......................................................
15
Figure 6: GCX Roll Stand Poly-mount
......................................
16
Figure 7: GCX Utility Basket
.....................................................
17
Figure 8: Soft Sided Carrying Case
..........................................
18
Figure 9: Monitoring Mode Display
-
Pleth View
.......................
30
Figure 10: Monitoring Mode Display
-
Blip (Magnified) View
....
30
Figure
11
:
Alarm Response with Satseconds
............................
36
Figure 12: Alarm Limits Selection
............................................... 46
Figure 13:
Sp02 Trend
...............................................................
47
Figure 14: Dual Trend Display
.....................................................
48
Figure 15:
Sp02 Trend Display
..................................................
49
Figure 16: Pulse Rate Trend Display
..........................................
49
Figure 17: Histogram
..................................................................
50
Figure 18: AMP Trend Display
...................................................
50
Figure 19: 40-Second Trends
.....................................................
51
Figure 20:
SpaceLabs Connection
.............................................
55
Figure 21
:
Oxyhemoglobin Dissociation Curve
..........................
85
Figure 22: Data Port Pin Layout
.................................................
89
Figure 23: Real-Time Printout
....................................................
91
Figure 24: Trend Data Printout (ASCII MODE)
..........................
95
Figure 25: Trend Data Printout (GRAPH MODE)
.......................
95