9
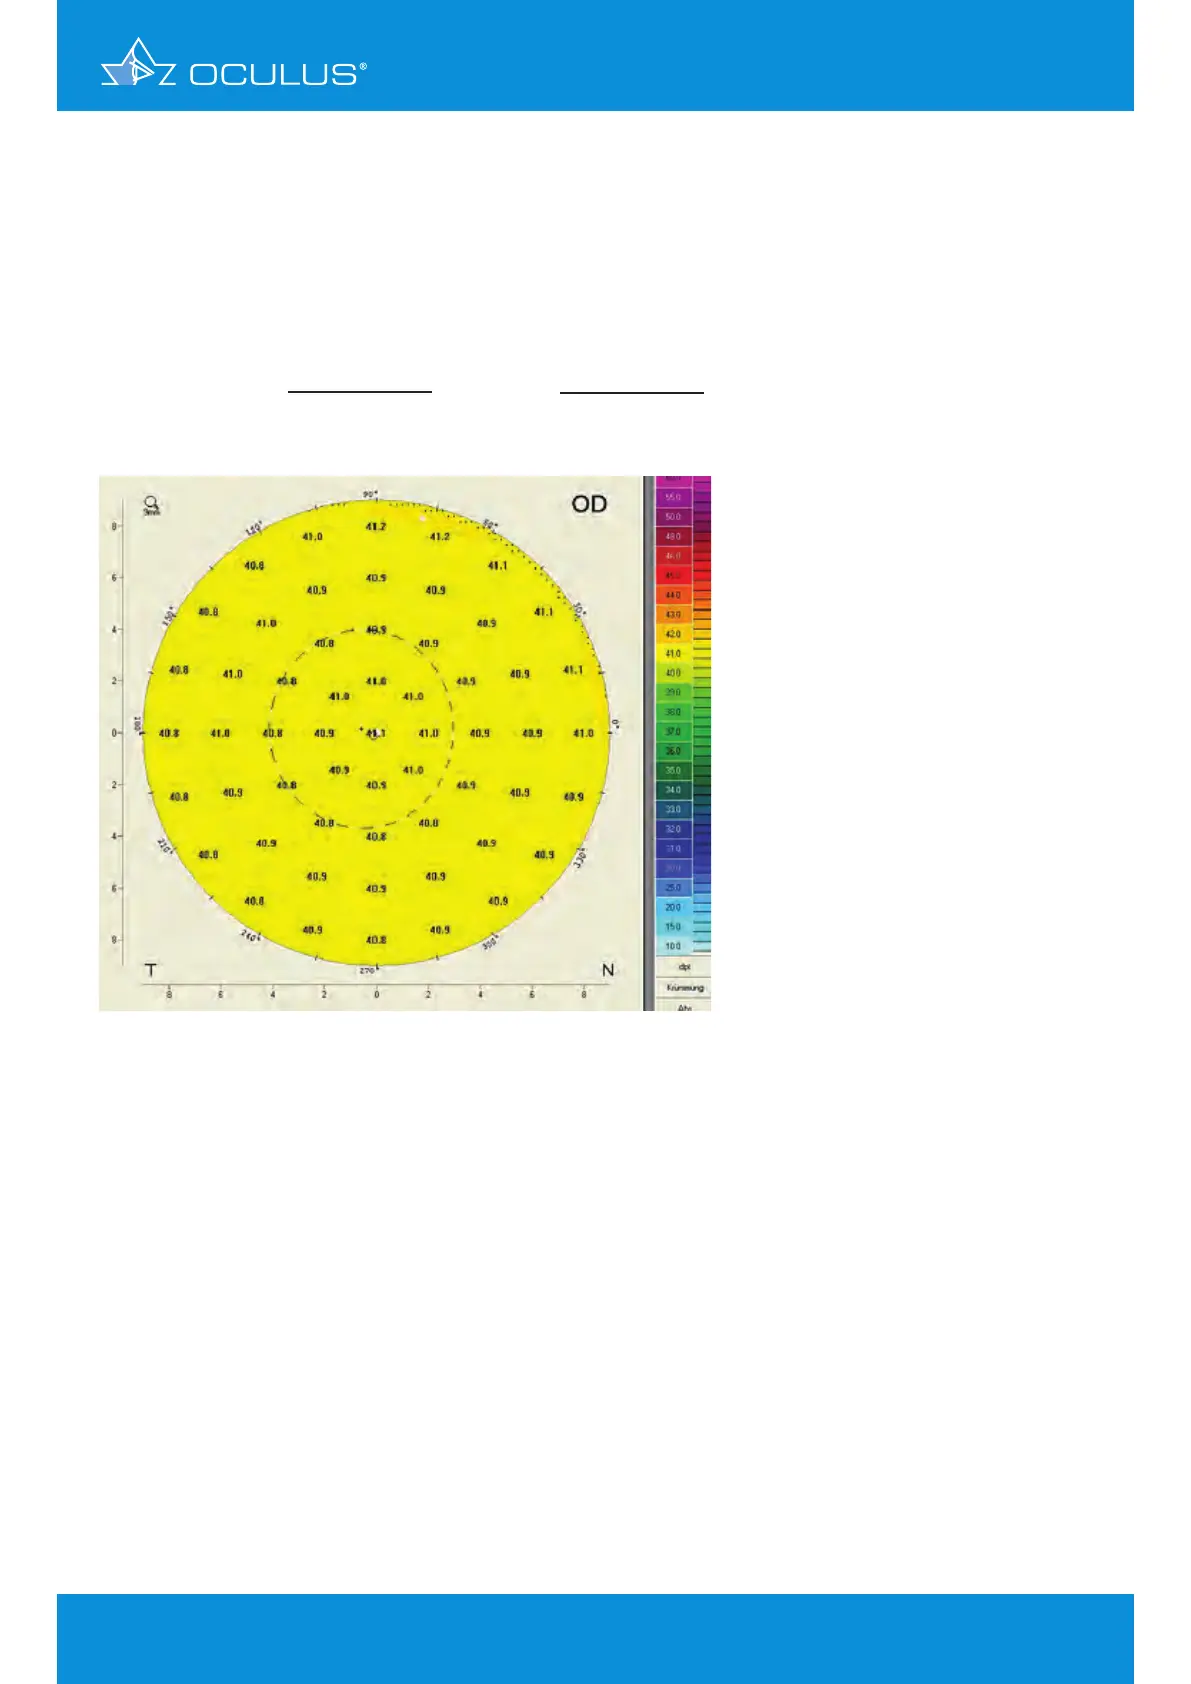
3.4 True Net Power
This map (Figure 4) shows the optical power of the cornea based on two different refractive indices,
one for the anterior (corneal tissue: 1.376) and one for the posterior surface (aqueous humour:
1.336), as well as the sagittal curvature of each. These results are aggregated. The True Net Power
map thus takes effects “A” and "B" into account. The underlying equation is:
Figure 4: True Net Power map calculated by two spheric surfaces of
anterior r = 8 mm and posterior r = 6.58 mm
3 Differences between the various topography maps of Pentacam
®
TrueNet Power =
1,376 -1
1,336 -1,376
*
1000 +
*
1000
r
ant_surface
r
post_surface