Bode 100 User Manual
56
case when the DUT’s impedance equals the reference resistance and,
consequently, the reflection coefficient is zero.
Additionally, the Smith chart contains circles with constant resistance ( )
and constant reactance ( ). This diagram format allows an easy "translation"
of any point of the reflection coefficient curve into the corresponding DUT’s
impedance. The cursor values displayed in the Smith chart format are the
real and imaginary components of the corresponding DUT’s impedance. For
more information on the Smith chart, refer to the relevant technical literature.
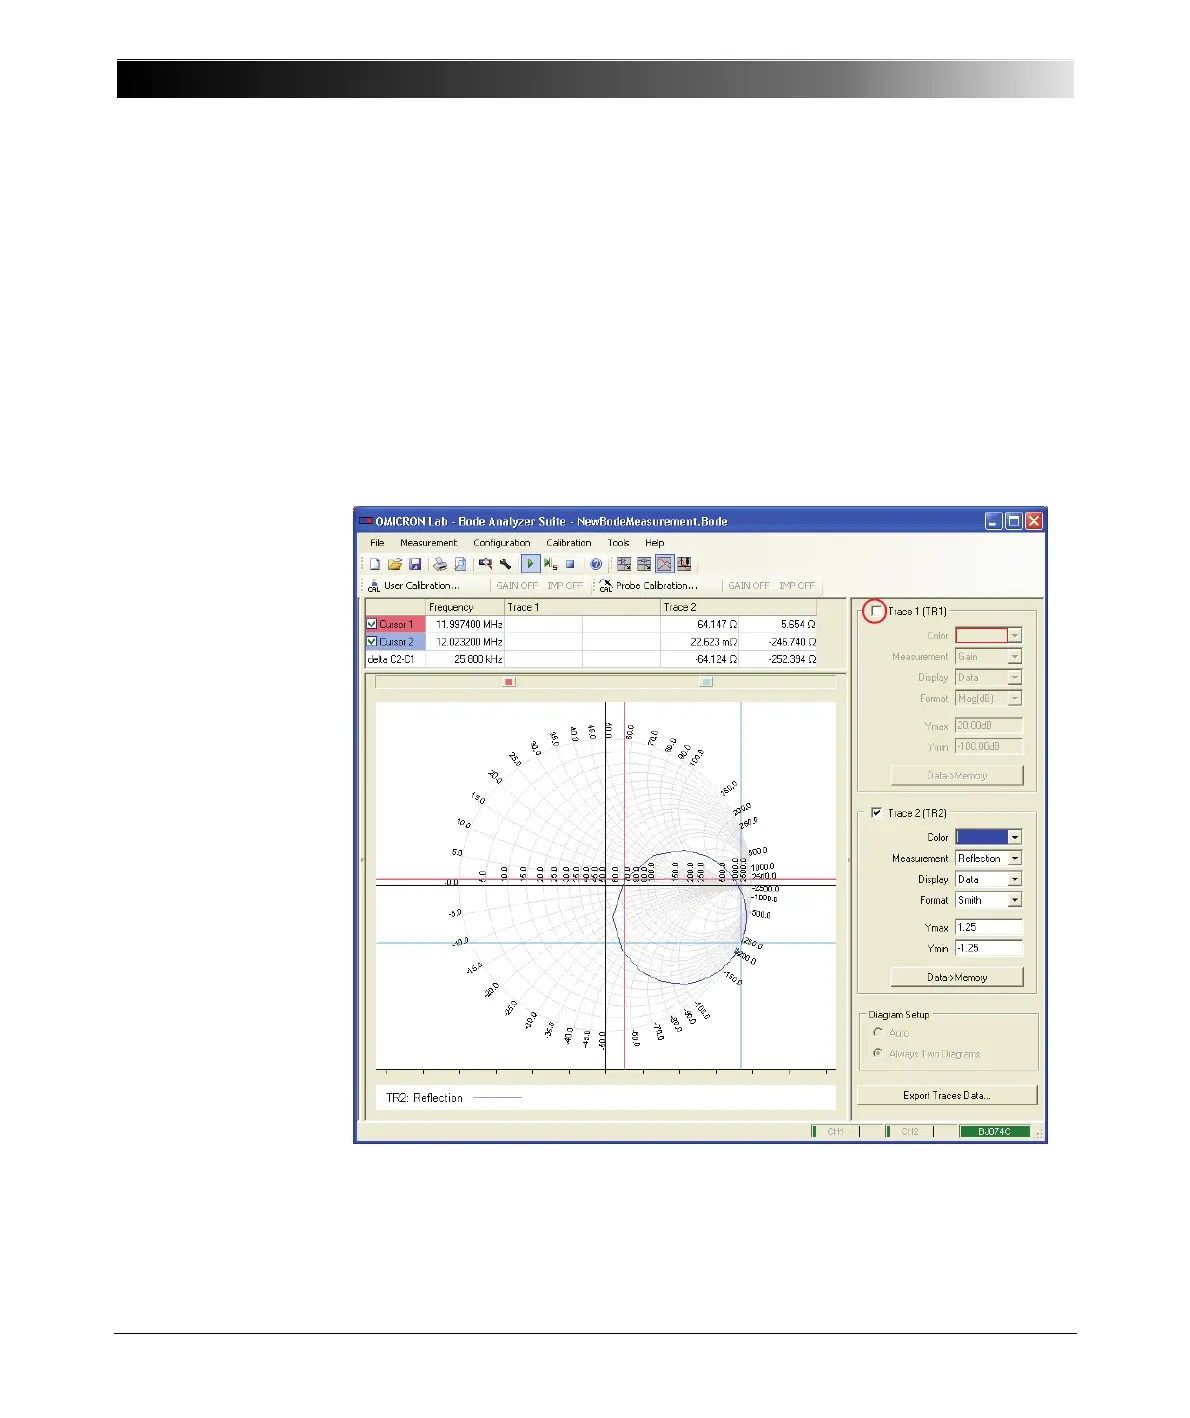
17.In the lower graph you see the Smith chart showing the reflection coefficient
of the quartz filter. To display only this chart, clear the Trace 1 check box to
deactivate trace 1.
Since the output of the DUT (quartz filter) is connected to the channel 2 input,
the measured impedance is the quartz impedance plus the 50 Ω input
impedance of the Bode 100.
R
X